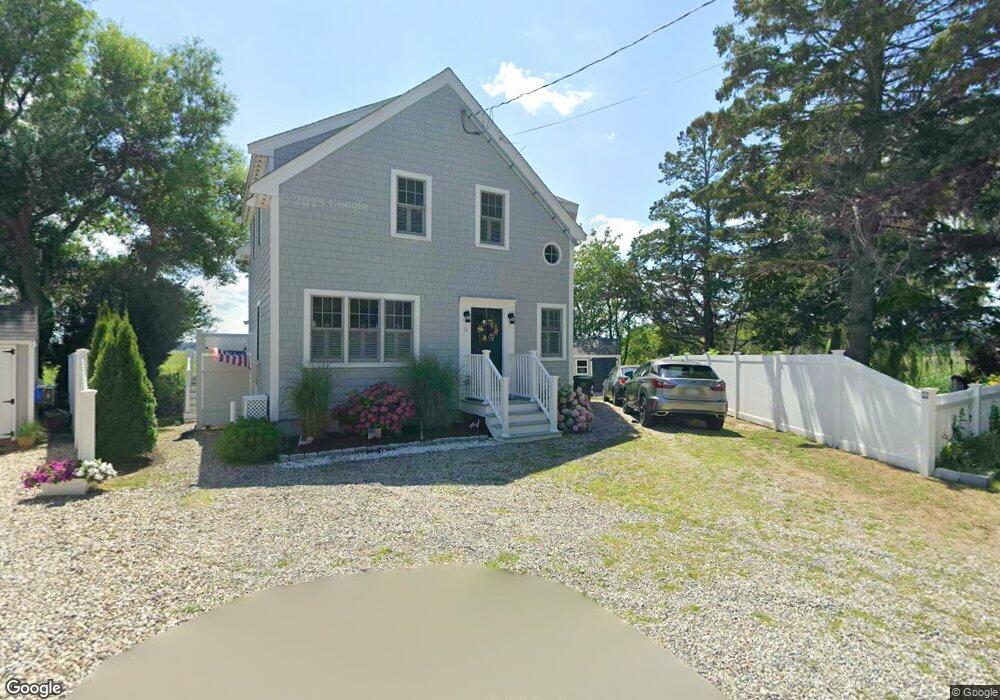
10 Craddock Rd Marshfield, MA 02050
Green Harbor-Cedar Crest NeighborhoodEstimated Value: $900,000 - $1,057,000
2
Beds
2
Baths
2,072
Sq Ft
$475/Sq Ft
Est. Value
About This Home
This home is located at 10 Craddock Rd, Marshfield, MA 02050 and is currently estimated at $984,378, approximately $475 per square foot. 10 Craddock Rd is a home with nearby schools including Governor Edward Winslow School, Furnace Brook Middle School, and Marshfield High School.
Ownership History
Date
Name
Owned For
Owner Type
Purchase Details
Closed on
Dec 27, 2016
Sold by
Martin Kathleen M
Bought by
Martin Kathleen M and Martin Phillip R
Current Estimated Value
Home Financials for this Owner
Home Financials are based on the most recent Mortgage that was taken out on this home.
Original Mortgage
$369,000
Outstanding Balance
$293,268
Interest Rate
3.57%
Mortgage Type
New Conventional
Estimated Equity
$691,110
Create a Home Valuation Report for This Property
The Home Valuation Report is an in-depth analysis detailing your home's value as well as a comparison with similar homes in the area
Home Values in the Area
Average Home Value in this Area
Purchase History
| Date | Buyer | Sale Price | Title Company |
|---|---|---|---|
| Martin Kathleen M | -- | -- |
Source: Public Records
Mortgage History
| Date | Status | Borrower | Loan Amount |
|---|---|---|---|
| Open | Martin Kathleen M | $369,000 |
Source: Public Records
Tax History
| Year | Tax Paid | Tax Assessment Tax Assessment Total Assessment is a certain percentage of the fair market value that is determined by local assessors to be the total taxable value of land and additions on the property. | Land | Improvement |
|---|---|---|---|---|
| 2025 | $9,121 | $921,300 | $336,800 | $584,500 |
| 2024 | $8,832 | $850,000 | $316,900 | $533,100 |
| 2023 | $8,086 | $749,000 | $285,300 | $463,700 |
| 2022 | $8,086 | $624,400 | $237,700 | $386,700 |
| 2021 | $7,703 | $584,000 | $237,700 | $346,300 |
| 2020 | $7,254 | $544,200 | $208,000 | $336,200 |
| 2019 | $7,012 | $524,100 | $208,000 | $316,100 |
| 2018 | $2,953 | $220,900 | $208,000 | $12,900 |
| 2017 | $3,781 | $275,600 | $208,000 | $67,600 |
| 2016 | $3,785 | $272,700 | $208,000 | $64,700 |
| 2015 | $3,493 | $262,800 | $198,100 | $64,700 |
| 2014 | $3,575 | $269,000 | $208,000 | $61,000 |
Source: Public Records
Map
Nearby Homes
- 71 Gurnet Rd
- 106 Careswell St
- 116 Island St
- 116 Outlook Rd
- 122 June St
- 78 Tower Ave
- 17 Dyke Rd
- 68 Abrams Hill Rd
- 236 Powder Point Ave
- 387 Lot 2A Old Cove Rd
- 387 Lot 3A Old Cove Rd
- 387 Lot 4A Old Cove Rd
- 86 Barouche Dr
- 32 Gratto Rd
- 19 2nd Rd
- 242 Enterprise St
- 54 Chapel St
- Two Railroad Ave Unit 9
- Two Railroad Ave Unit 1
- Two Railroad Ave Unit 8