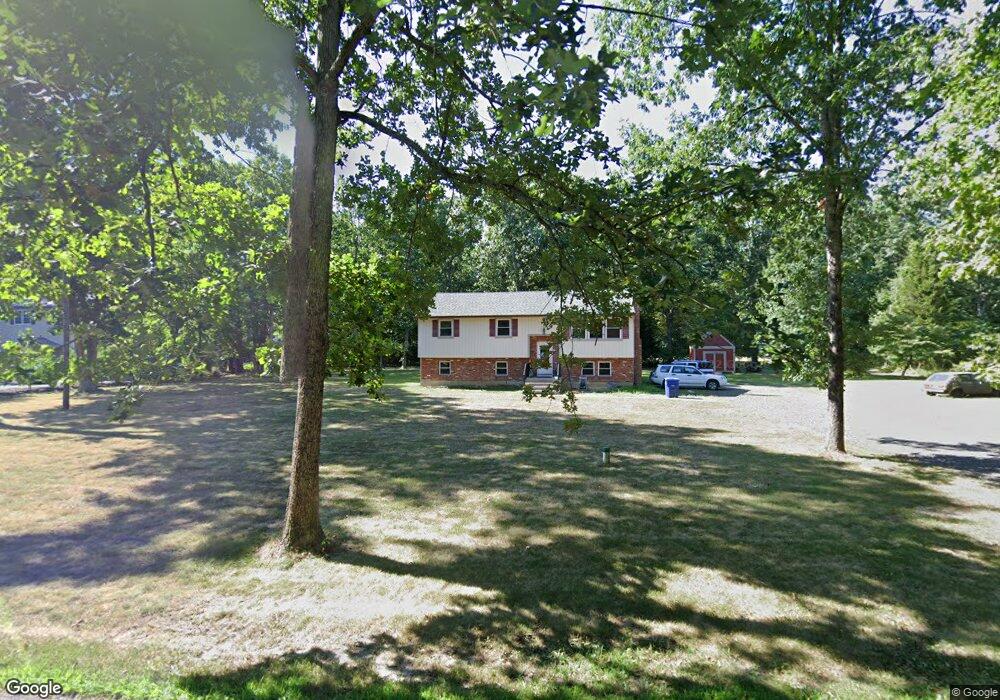
10 Cramer Rd Tabernacle, NJ 08088
Estimated Value: $440,000 - $551,000
4
Beds
3
Baths
1,844
Sq Ft
$258/Sq Ft
Est. Value
About This Home
This home is located at 10 Cramer Rd, Tabernacle, NJ 08088 and is currently estimated at $475,785, approximately $258 per square foot. 10 Cramer Rd is a home located in Burlington County with nearby schools including Tabernacle Elementary School, Kenneth R Olson Mid School, and Seneca High School.
Ownership History
Date
Name
Owned For
Owner Type
Purchase Details
Closed on
Mar 19, 2008
Sold by
Broughton Peggy
Bought by
Bocko Natasha L
Current Estimated Value
Home Financials for this Owner
Home Financials are based on the most recent Mortgage that was taken out on this home.
Original Mortgage
$200,000
Outstanding Balance
$128,294
Interest Rate
6.3%
Mortgage Type
Purchase Money Mortgage
Estimated Equity
$347,491
Purchase Details
Closed on
Oct 24, 1997
Sold by
Broughton Ronald
Bought by
Broughton Peggy
Create a Home Valuation Report for This Property
The Home Valuation Report is an in-depth analysis detailing your home's value as well as a comparison with similar homes in the area
Home Values in the Area
Average Home Value in this Area
Purchase History
| Date | Buyer | Sale Price | Title Company |
|---|---|---|---|
| Bocko Natasha L | $250,000 | Surety Title Corporation | |
| Broughton Peggy | -- | -- |
Source: Public Records
Mortgage History
| Date | Status | Borrower | Loan Amount |
|---|---|---|---|
| Open | Bocko Natasha L | $200,000 |
Source: Public Records
Tax History
| Year | Tax Paid | Tax Assessment Tax Assessment Total Assessment is a certain percentage of the fair market value that is determined by local assessors to be the total taxable value of land and additions on the property. | Land | Improvement |
|---|---|---|---|---|
| 2025 | $7,098 | $214,300 | $55,000 | $159,300 |
| 2024 | $6,502 | $214,300 | $55,000 | $159,300 |
| 2023 | $6,502 | $214,300 | $55,000 | $159,300 |
| 2022 | $6,305 | $214,300 | $55,000 | $159,300 |
| 2021 | $6,416 | $214,300 | $55,000 | $159,300 |
| 2020 | $6,500 | $214,300 | $55,000 | $159,300 |
| 2019 | $6,305 | $214,300 | $55,000 | $159,300 |
| 2018 | $5,995 | $207,600 | $55,000 | $152,600 |
| 2017 | $5,958 | $207,600 | $55,000 | $152,600 |
| 2016 | $5,773 | $207,600 | $55,000 | $152,600 |
| 2015 | $5,724 | $207,600 | $55,000 | $152,600 |
| 2014 | $5,497 | $207,600 | $55,000 | $152,600 |
Source: Public Records
Map
Nearby Homes
- 22 Richter Rd
- 18 Forest Ln
- 13 Mallard Dr
- 45 Lakeview Dr
- 7 Mallard Dr
- 19 Sandra Ln
- 66 Summit Dr
- 52 Summit Dr
- 1666 Route 206
- 4 Allen Ct
- 7 Wicklow Dr
- 49 Magnolia Ln
- 18 Waltham Dr
- 3 Dogwood E
- 83 Holly Ct
- 4 Wimbeldon Way
- 42 Mockingbird Way
- 50 Constitution Dr
- 32 Constitution Dr
- 0 Stevenson Unit NJBL2105846
Your Personal Tour Guide
Ask me questions while you tour the home.