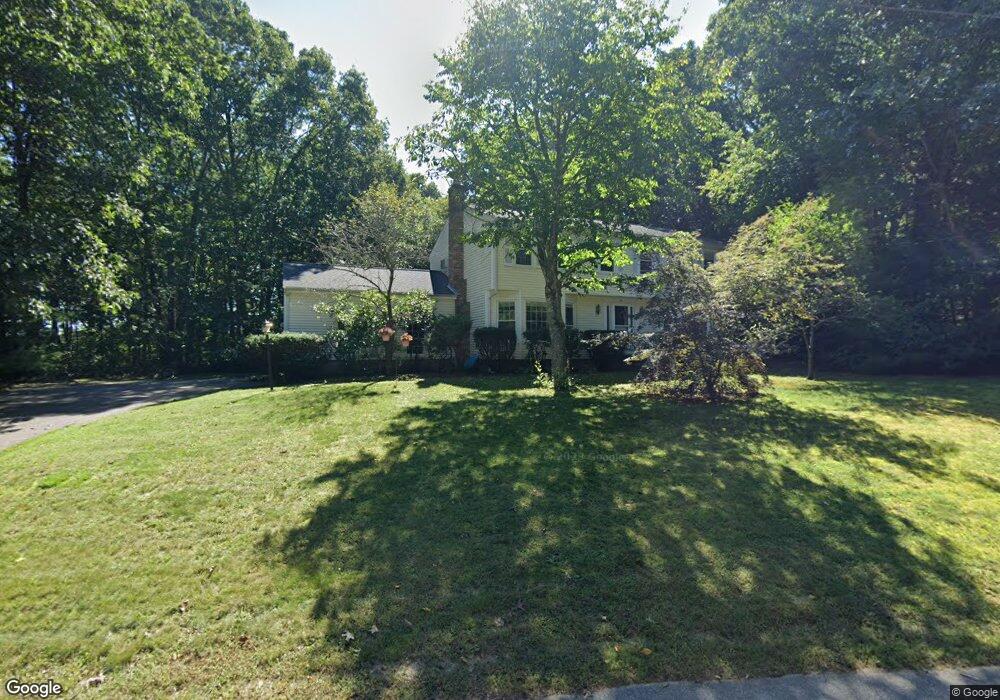
10 Crestview Dr Millis, MA 02054
Estimated Value: $711,088 - $946,000
4
Beds
3
Baths
2,356
Sq Ft
$345/Sq Ft
Est. Value
About This Home
This home is located at 10 Crestview Dr, Millis, MA 02054 and is currently estimated at $811,772, approximately $344 per square foot. 10 Crestview Dr is a home located in Norfolk County with nearby schools including Clyde F Brown, Millis Middle School, and Millis High School.
Ownership History
Date
Name
Owned For
Owner Type
Purchase Details
Closed on
Jan 12, 2023
Sold by
Ottenstein John S and Rubin Tibel B
Bought by
10 Crestview Dr Rt
Current Estimated Value
Purchase Details
Closed on
Aug 14, 2006
Sold by
Shea Barbara D and Shea Robert J
Bought by
Ottenstein John S and Rubin Tibel B
Home Financials for this Owner
Home Financials are based on the most recent Mortgage that was taken out on this home.
Original Mortgage
$322,500
Interest Rate
6.8%
Mortgage Type
Purchase Money Mortgage
Create a Home Valuation Report for This Property
The Home Valuation Report is an in-depth analysis detailing your home's value as well as a comparison with similar homes in the area
Home Values in the Area
Average Home Value in this Area
Purchase History
| Date | Buyer | Sale Price | Title Company |
|---|---|---|---|
| 10 Crestview Dr Rt | -- | None Available | |
| Ottenstein John S | $507,500 | -- |
Source: Public Records
Mortgage History
| Date | Status | Borrower | Loan Amount |
|---|---|---|---|
| Previous Owner | Ottenstein John S | $322,500 |
Source: Public Records
Tax History
| Year | Tax Paid | Tax Assessment Tax Assessment Total Assessment is a certain percentage of the fair market value that is determined by local assessors to be the total taxable value of land and additions on the property. | Land | Improvement |
|---|---|---|---|---|
| 2025 | $9,971 | $608,000 | $191,900 | $416,100 |
| 2024 | $9,400 | $572,500 | $191,900 | $380,600 |
| 2023 | $9,364 | $535,400 | $166,800 | $368,600 |
| 2022 | $9,068 | $480,300 | $166,800 | $313,500 |
| 2021 | $9,064 | $462,000 | $166,800 | $295,200 |
| 2020 | $8,868 | $440,300 | $155,900 | $284,400 |
| 2019 | $7,919 | $423,500 | $147,300 | $276,200 |
| 2018 | $7,390 | $410,100 | $133,900 | $276,200 |
| 2017 | $7,340 | $398,500 | $147,600 | $250,900 |
| 2016 | $6,950 | $398,500 | $147,600 | $250,900 |
| 2015 | $6,775 | $398,500 | $147,600 | $250,900 |
Source: Public Records
Map
Nearby Homes
Your Personal Tour Guide
Ask me questions while you tour the home.