Estimated Value: $147,000 - $168,000
2
Beds
1
Bath
716
Sq Ft
$224/Sq Ft
Est. Value
About This Home
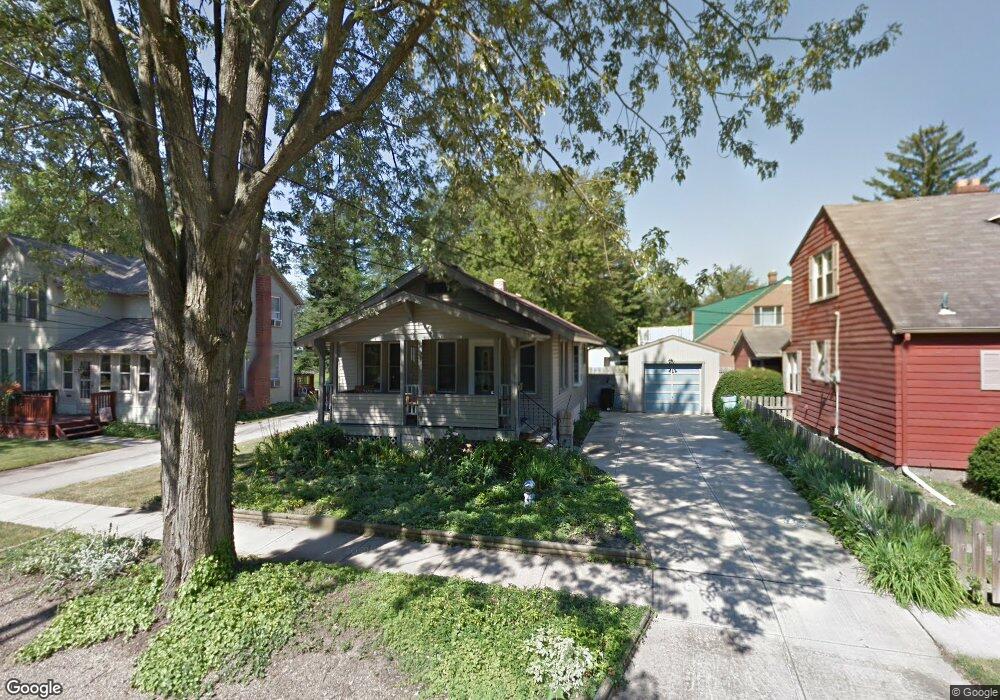
This home is located at 10 Crocker St, Berea, OH 44017 and is currently estimated at $160,444, approximately $224 per square foot. 10 Crocker St is a home located in Cuyahoga County with nearby schools including Grindstone Elementary School, Berea-Midpark Middle School, and Berea-Midpark High School.
Ownership History
Date
Name
Owned For
Owner Type
Purchase Details
Closed on
May 2, 2023
Sold by
Rajas James Susan
Bought by
Durica Denis
Current Estimated Value
Purchase Details
Closed on
Dec 29, 2005
Sold by
Fulton Barbara M
Bought by
Halas Margaret A
Home Financials for this Owner
Home Financials are based on the most recent Mortgage that was taken out on this home.
Original Mortgage
$74,625
Interest Rate
5.75%
Mortgage Type
Purchase Money Mortgage
Purchase Details
Closed on
Oct 31, 1989
Sold by
Paroda Robert M
Bought by
Fulton Robert C
Purchase Details
Closed on
Dec 7, 1977
Sold by
Linn Robert G
Bought by
Paroda Robert M
Purchase Details
Closed on
Sep 20, 1977
Sold by
Linn Robert G
Bought by
Linn Robert G
Purchase Details
Closed on
Apr 13, 1976
Sold by
Bak Edward C
Bought by
Linn Robert G
Purchase Details
Closed on
Jan 1, 1975
Bought by
Bak Edward C
Create a Home Valuation Report for This Property
The Home Valuation Report is an in-depth analysis detailing your home's value as well as a comparison with similar homes in the area
Home Values in the Area
Average Home Value in this Area
Purchase History
| Date | Buyer | Sale Price | Title Company |
|---|---|---|---|
| Durica Denis | $135,000 | Maximum Title | |
| Halas Margaret A | $99,500 | Public | |
| Fulton Robert C | $58,300 | -- | |
| Paroda Robert M | $35,000 | -- | |
| Linn Robert G | -- | -- | |
| Linn Robert G | $27,500 | -- | |
| Bak Edward C | -- | -- |
Source: Public Records
Mortgage History
| Date | Status | Borrower | Loan Amount |
|---|---|---|---|
| Previous Owner | Halas Margaret A | $74,625 |
Source: Public Records
Tax History
| Year | Tax Paid | Tax Assessment Tax Assessment Total Assessment is a certain percentage of the fair market value that is determined by local assessors to be the total taxable value of land and additions on the property. | Land | Improvement |
|---|---|---|---|---|
| 2024 | $2,970 | $51,380 | $9,065 | $42,315 |
| 2023 | $2,576 | $36,480 | $7,250 | $29,230 |
| 2022 | $2,560 | $36,470 | $7,250 | $29,230 |
| 2021 | $2,540 | $36,470 | $7,250 | $29,230 |
| 2020 | $2,426 | $30,910 | $6,130 | $24,780 |
| 2019 | $2,363 | $88,300 | $17,500 | $70,800 |
| 2018 | $2,355 | $30,910 | $6,130 | $24,780 |
| 2017 | $2,550 | $31,120 | $5,850 | $25,270 |
| 2016 | $2,531 | $31,120 | $5,850 | $25,270 |
| 2015 | $2,396 | $31,120 | $5,850 | $25,270 |
| 2014 | $2,396 | $31,120 | $5,850 | $25,270 |
Source: Public Records
Map
Nearby Homes
- 209 Gibson St
- 211 W Bridge St
- 160 Marian Ln Unit 6A
- 516 Fair St
- 388 Fairwood Cir
- 300 West St
- 287 Edgewood Dr
- 146 Marian Ln
- 404 Crescent Dr
- 57 Riverside Dr
- 49 Monroe St
- 347 Beeler Dr
- 275 Quarrystone Ln
- 550 Race St
- 93 W 5th Ave
- 487 Bridle Ln
- 8036 Fair Rd
- 23002 Chandlers Ln
- 23002 Chandlers Ln Unit 223
- 23002 Chandlers Ln Unit 221
Your Personal Tour Guide
Ask me questions while you tour the home.