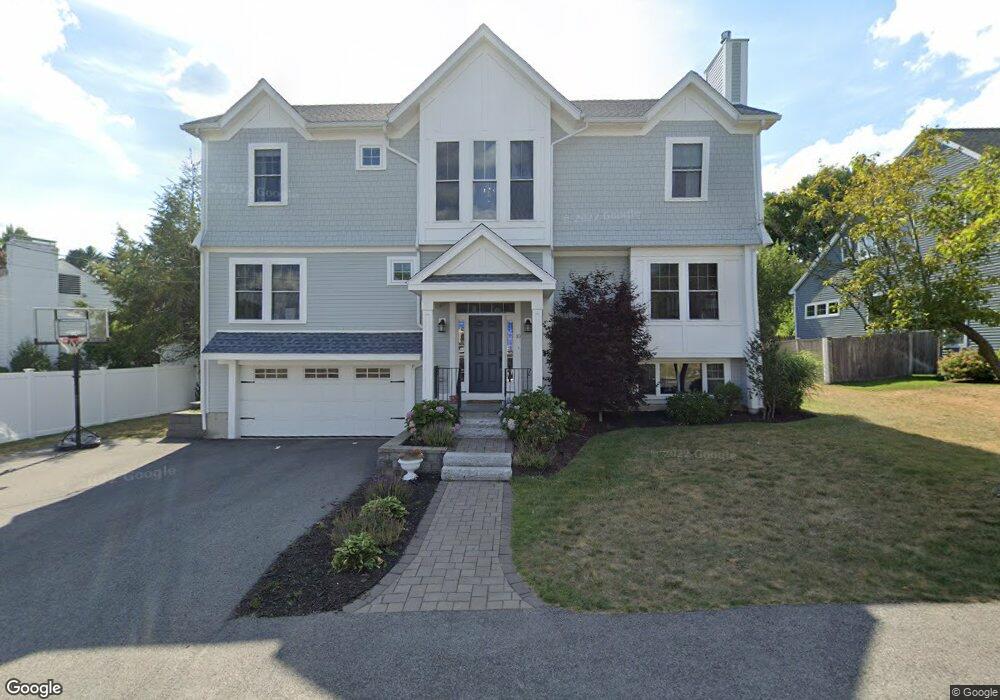
10 Cynthia Rd Needham Heights, MA 02494
Estimated Value: $1,369,000 - $1,802,087
3
Beds
3
Baths
1,320
Sq Ft
$1,188/Sq Ft
Est. Value
About This Home
This home is located at 10 Cynthia Rd, Needham Heights, MA 02494 and is currently estimated at $1,568,272, approximately $1,188 per square foot. 10 Cynthia Rd is a home located in Norfolk County with nearby schools including Sunita L. Williams Elementary School, High Rock Middle School, and Pollard Middle School.
Ownership History
Date
Name
Owned For
Owner Type
Purchase Details
Closed on
Jul 15, 2011
Sold by
Silverman Alyssa E and Silverman James M
Bought by
Faira Ann M and Faria Kaitlyn C
Current Estimated Value
Home Financials for this Owner
Home Financials are based on the most recent Mortgage that was taken out on this home.
Original Mortgage
$468,000
Outstanding Balance
$323,032
Interest Rate
4.58%
Mortgage Type
Purchase Money Mortgage
Estimated Equity
$1,245,240
Purchase Details
Closed on
Jul 31, 2009
Sold by
Cynthia Road Rt and Gould Daniel Z
Bought by
Silverman James M and Winer Alyssa E
Home Financials for this Owner
Home Financials are based on the most recent Mortgage that was taken out on this home.
Original Mortgage
$406,250
Interest Rate
5.43%
Mortgage Type
Purchase Money Mortgage
Create a Home Valuation Report for This Property
The Home Valuation Report is an in-depth analysis detailing your home's value as well as a comparison with similar homes in the area
Home Values in the Area
Average Home Value in this Area
Purchase History
| Date | Buyer | Sale Price | Title Company |
|---|---|---|---|
| Faira Ann M | $585,000 | -- | |
| Silverman James M | $575,000 | -- |
Source: Public Records
Mortgage History
| Date | Status | Borrower | Loan Amount |
|---|---|---|---|
| Open | Faira Ann M | $468,000 | |
| Previous Owner | Silverman James M | $406,250 |
Source: Public Records
Tax History
| Year | Tax Paid | Tax Assessment Tax Assessment Total Assessment is a certain percentage of the fair market value that is determined by local assessors to be the total taxable value of land and additions on the property. | Land | Improvement |
|---|---|---|---|---|
| 2025 | $16,078 | $1,516,800 | $742,800 | $774,000 |
| 2024 | $14,665 | $1,171,300 | $492,000 | $679,300 |
| 2023 | $14,497 | $1,111,700 | $492,000 | $619,700 |
| 2022 | $13,846 | $1,035,600 | $443,300 | $592,300 |
| 2021 | $13,494 | $1,035,600 | $443,300 | $592,300 |
| 2020 | $13,336 | $1,067,700 | $443,300 | $624,400 |
| 2019 | $12,638 | $1,020,000 | $403,100 | $616,900 |
| 2018 | $12,118 | $1,020,000 | $403,100 | $616,900 |
| 2017 | $11,165 | $939,000 | $403,100 | $535,900 |
| 2016 | $7,015 | $607,900 | $403,100 | $204,800 |
| 2015 | $6,863 | $607,900 | $403,100 | $204,800 |
| 2014 | $6,588 | $566,000 | $366,500 | $199,500 |
Source: Public Records
Map
Nearby Homes
- 36 Eliot Rd
- 12 Hill St
- 34 Pershing Rd
- 81 Parish Rd
- 70 Briarwood Cir
- 379 Hunnewell St Unit 379
- 3 Crescent Rd
- 140 Hillside Ave
- 140 Hillside Ave Unit a
- 134 Hillside Ave Unit 134
- 132 Hillside Ave
- 102 Jarvis Cir Unit 102
- 385 Hillside Ave
- 385 Hillside Ave Unit 385
- 48 Taylor St
- 447 Hillside Ave
- 100 Rosemary Way Unit 129
- 345 Central Ave
- 3 Hancock Rd
- 28 Mercer Rd
Your Personal Tour Guide
Ask me questions while you tour the home.