10 Cyr Dr Lawrence, MA 01843
Mount Vernon NeighborhoodEstimated Value: $556,000 - $620,806
About This Home
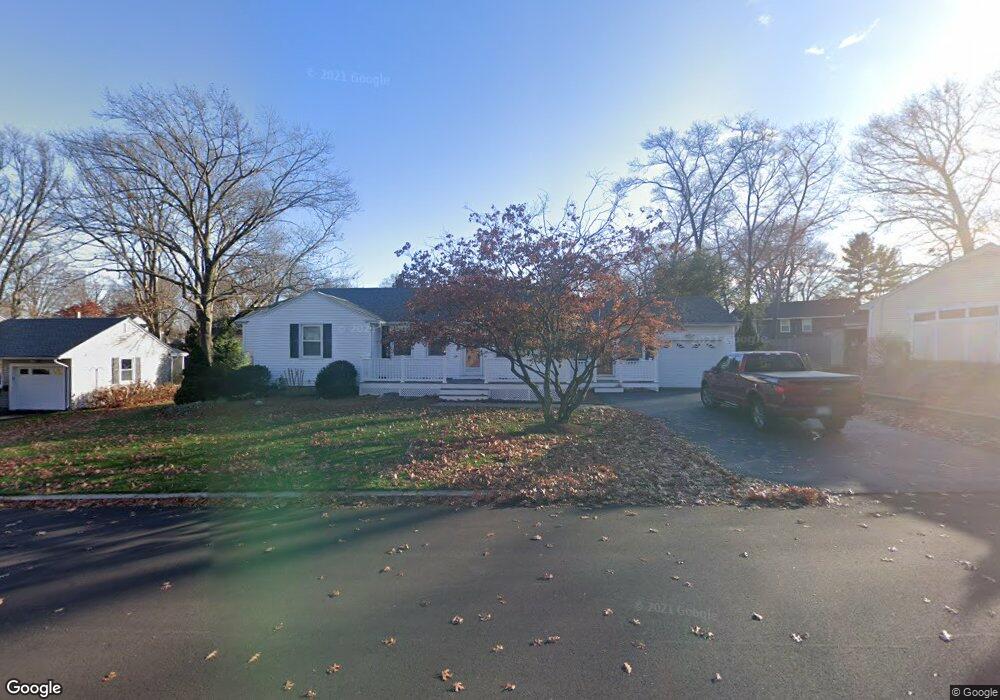
This home is located at 10 Cyr Dr, Lawrence, MA 01843 and is currently estimated at $584,702, approximately $369 per square foot. 10 Cyr Dr is a home located in Essex County with nearby schools including John Breen School, School For Exceptional Studies, and Robert Frost Middle School.
Ownership History
We collect this data history from publicly available records. To have your information removed, we recommend requesting removal directly through your county’s website.
Purchase Details
Purchase Details
Purchase Details
Purchase Details
Home Values in the Area
Average Home Value in this Area
Purchase History
We collect this data history from publicly available records. To have your information removed, we recommend requesting removal directly through your county’s website.
| Date | Buyer | Sale Price | Title Company |
|---|---|---|---|
| -- | None Available | ||
| -- | None Available | ||
| -- | -- | ||
| -- | -- |
Mortgage History
We collect this data history from publicly available records. To have your information removed, we recommend requesting removal directly through your county’s website.
| Date | Status | Borrower | Loan Amount |
|---|---|---|---|
| Previous Owner | $58,500 | ||
| Previous Owner | $116,500 | ||
| Previous Owner | $100,000 | ||
| Previous Owner | $25,000 |
Tax History
We collect this data history from publicly available records. To have your information removed, we recommend requesting removal directly through your county’s website.
| Year | Tax Paid | Tax Assessment Tax Assessment Total Assessment is a certain percentage of the fair market value that is determined by local assessors to be the total taxable value of land and additions on the property. | Land | Improvement |
|---|---|---|---|---|
| 2025 | $5,092 | $578,600 | $197,600 | $381,000 |
| 2024 | $4,728 | $511,100 | $166,100 | $345,000 |
| 2023 | $4,976 | $489,800 | $166,100 | $323,700 |
| 2022 | $4,853 | $424,200 | $151,500 | $272,700 |
| 2021 | $4,584 | $373,600 | $148,400 | $225,200 |
| 2020 | $4,515 | $363,200 | $138,000 | $225,200 |
| 2019 | $4,435 | $324,200 | $120,600 | $203,600 |
| 2018 | $4,207 | $293,800 | $114,600 | $179,200 |
| 2017 | $4,079 | $265,900 | $109,200 | $156,700 |
| 2016 | $3,953 | $254,900 | $94,200 | $160,700 |
| 2015 | $3,854 | $254,900 | $94,200 | $160,700 |
Map
- 90 Beacon St Unit 12
- 11 Hale St
- 17 Gorham St
- 77 Corbett St
- 17 Juliette St
- 401 S Broadway
- 2 Amherst Rd
- 5 Lafayette Ave
- 539-541 S Broadway
- 115 Beacon Ave Unit A
- 2 Andover Terrace
- 8 Brookfield St
- 11 Swan Ln Unit 11
- 9 Swan Ln
- 110-112 Everett St
- 21 Clubview Dr Unit 21
- 14 Tyler St Unit 1
- 59 William St
- 33 Garfield St
- 2 Dove Ln Unit 2
Ask me questions while you tour the home.