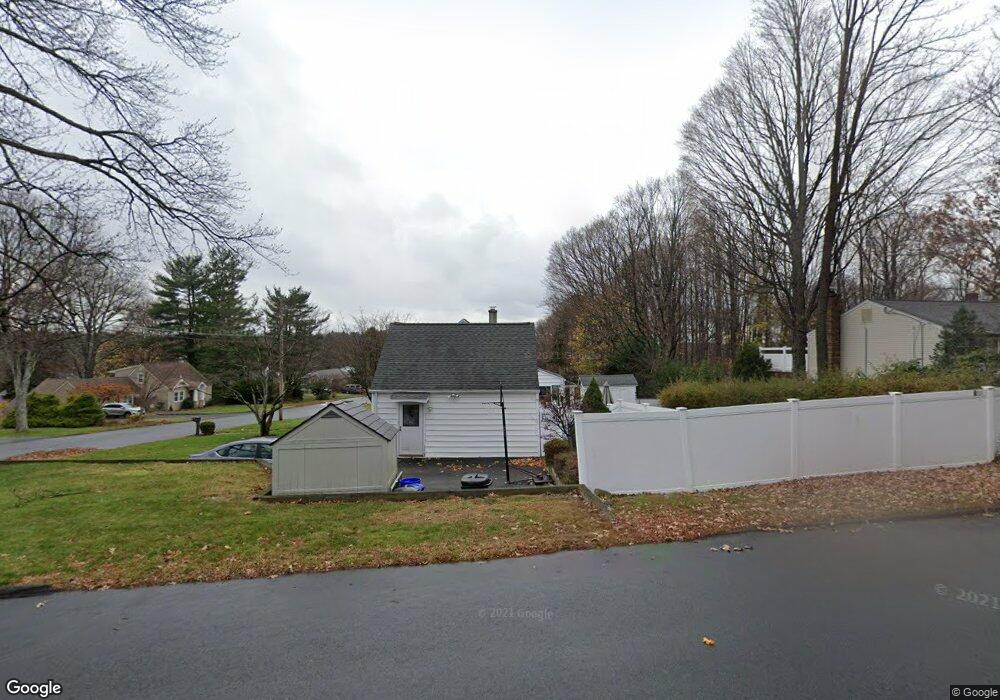
10 Dalrymple St Randolph, NJ 07869
Estimated Value: $445,417 - $605,000
Studio
--
Bath
1,080
Sq Ft
$486/Sq Ft
Est. Value
About This Home
This home is located at 10 Dalrymple St, Randolph, NJ 07869 and is currently estimated at $525,104, approximately $486 per square foot. 10 Dalrymple St is a home located in Morris County with nearby schools including Randolph High School, Randolph Middle School, and Apple Montessori Schools and Camps - Randolph.
Ownership History
Date
Name
Owned For
Owner Type
Purchase Details
Closed on
May 5, 2023
Sold by
Valle Santos
Bought by
Valle Carolina
Current Estimated Value
Purchase Details
Closed on
Jun 5, 2006
Sold by
Edwards Ann M
Bought by
Valle Santos
Home Financials for this Owner
Home Financials are based on the most recent Mortgage that was taken out on this home.
Original Mortgage
$304,000
Interest Rate
6.62%
Mortgage Type
New Conventional
Create a Home Valuation Report for This Property
The Home Valuation Report is an in-depth analysis detailing your home's value as well as a comparison with similar homes in the area
Home Values in the Area
Average Home Value in this Area
Purchase History
| Date | Buyer | Sale Price | Title Company |
|---|---|---|---|
| Valle Carolina | -- | Old Republic National Title In | |
| Valle Carolina | -- | Old Republic National Title In | |
| Valle Santos | $370,000 | -- |
Source: Public Records
Mortgage History
| Date | Status | Borrower | Loan Amount |
|---|---|---|---|
| Previous Owner | Valle Santos | $304,000 |
Source: Public Records
Tax History
| Year | Tax Paid | Tax Assessment Tax Assessment Total Assessment is a certain percentage of the fair market value that is determined by local assessors to be the total taxable value of land and additions on the property. | Land | Improvement |
|---|---|---|---|---|
| 2025 | $8,518 | $300,900 | $146,500 | $154,400 |
| 2024 | $8,305 | $300,900 | $146,500 | $154,400 |
Source: Public Records
Map
Nearby Homes
- 3 Marble Ln
- 58 Conrad Place
- 121 W Munson Ave
- 107 High St
- 51 Linwood Ave
- 12 Birch St
- 343 & 339 Quaker Church Rd
- 31 Edinburgh Dr
- 142 W Blackwell St
- 170 Park Heights Ave
- 384 Millbrook Ave
- 77B Highland Way
- 67 Victory Ct Unit 67B
- 71 Washington Ave Unit 73
- 417 W Black Well St Ab
- 8 N Elk Ave
- 121 W Clinton St
- 12 Lincoln Ave
- 42 5th Ave
- 00 5th Ave
Your Personal Tour Guide
Ask me questions while you tour the home.