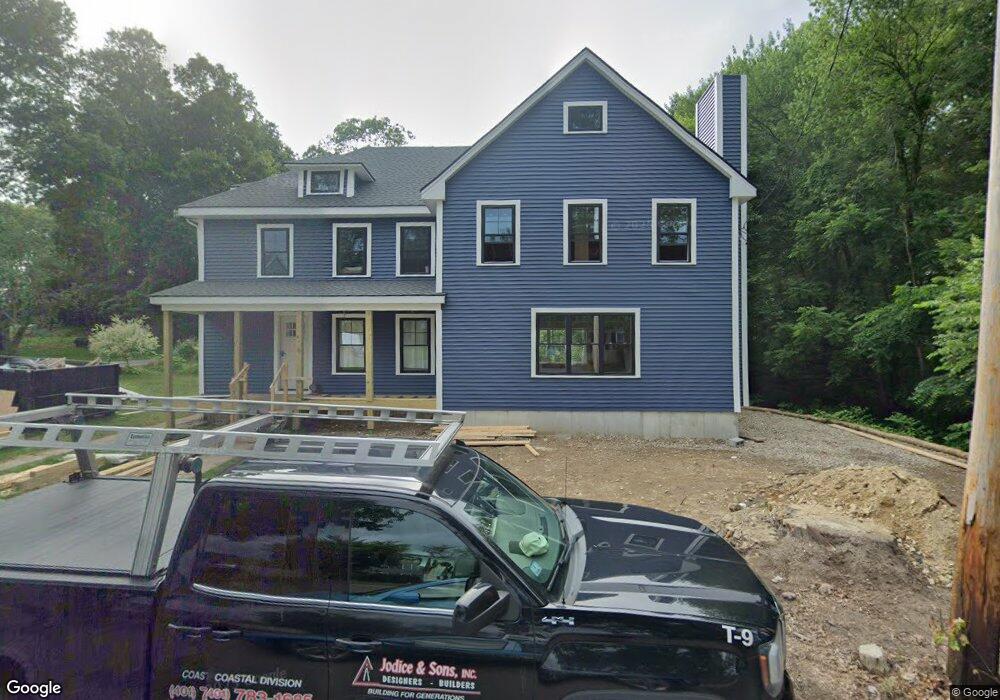
10 Dane St Mansfield, MA 02048
Estimated Value: $603,000 - $763,000
3
Beds
1
Bath
1,594
Sq Ft
$410/Sq Ft
Est. Value
About This Home
This home is located at 10 Dane St, Mansfield, MA 02048 and is currently estimated at $653,470, approximately $409 per square foot. 10 Dane St is a home located in Bristol County with nearby schools including Everett W. Robinson Elementary School, Jordan/Jackson Elementary School, and Harold L. Qualters Middle School.
Ownership History
Date
Name
Owned For
Owner Type
Purchase Details
Closed on
Sep 1, 2011
Sold by
Depalama Theresa D Est
Bought by
Parker 4Th James W and Hallett Stephanie A
Current Estimated Value
Home Financials for this Owner
Home Financials are based on the most recent Mortgage that was taken out on this home.
Original Mortgage
$214,423
Outstanding Balance
$146,765
Interest Rate
4.25%
Mortgage Type
FHA
Estimated Equity
$506,705
Create a Home Valuation Report for This Property
The Home Valuation Report is an in-depth analysis detailing your home's value as well as a comparison with similar homes in the area
Home Values in the Area
Average Home Value in this Area
Purchase History
| Date | Buyer | Sale Price | Title Company |
|---|---|---|---|
| Parker 4Th James W | $220,000 | -- |
Source: Public Records
Mortgage History
| Date | Status | Borrower | Loan Amount |
|---|---|---|---|
| Open | Parker 4Th James W | $214,423 |
Source: Public Records
Tax History
| Year | Tax Paid | Tax Assessment Tax Assessment Total Assessment is a certain percentage of the fair market value that is determined by local assessors to be the total taxable value of land and additions on the property. | Land | Improvement |
|---|---|---|---|---|
| 2025 | $6,758 | $513,100 | $261,400 | $251,700 |
| 2024 | $6,822 | $505,300 | $261,400 | $243,900 |
| 2023 | $6,662 | $472,800 | $261,400 | $211,400 |
| 2022 | $6,591 | $434,500 | $242,700 | $191,800 |
| 2021 | $6,273 | $397,600 | $211,800 | $185,800 |
| 2020 | $5,590 | $363,900 | $202,000 | $161,900 |
| 2019 | $5,356 | $351,900 | $169,300 | $182,600 |
| 2018 | $4,619 | $336,500 | $161,900 | $174,600 |
| 2017 | $6,411 | $329,000 | $157,600 | $171,400 |
| 2016 | $4,685 | $304,000 | $150,100 | $153,900 |
| 2015 | $4,514 | $291,200 | $150,100 | $141,100 |
Source: Public Records
Map
Nearby Homes
- 4 Concetta Cir
- 619 N Main St
- 25 Kingman Ave
- 81 Chilson Ave
- 22 Pleasant St Unit C
- 266 N Main St Unit 3
- 356 Central St
- 150 Rumford Ave Unit 110
- 166 Chauncy St
- 46 Hope St
- 28 Court St
- 152 Central St
- 44 Fairfield Park Unit 44
- 97 East St
- 261 East St
- 233 Central St
- 157 Central St
- 9 Independence Dr Unit 9
- 13 Summerville Rd Unit 13
- 132 Cannon Forge Dr
Your Personal Tour Guide
Ask me questions while you tour the home.