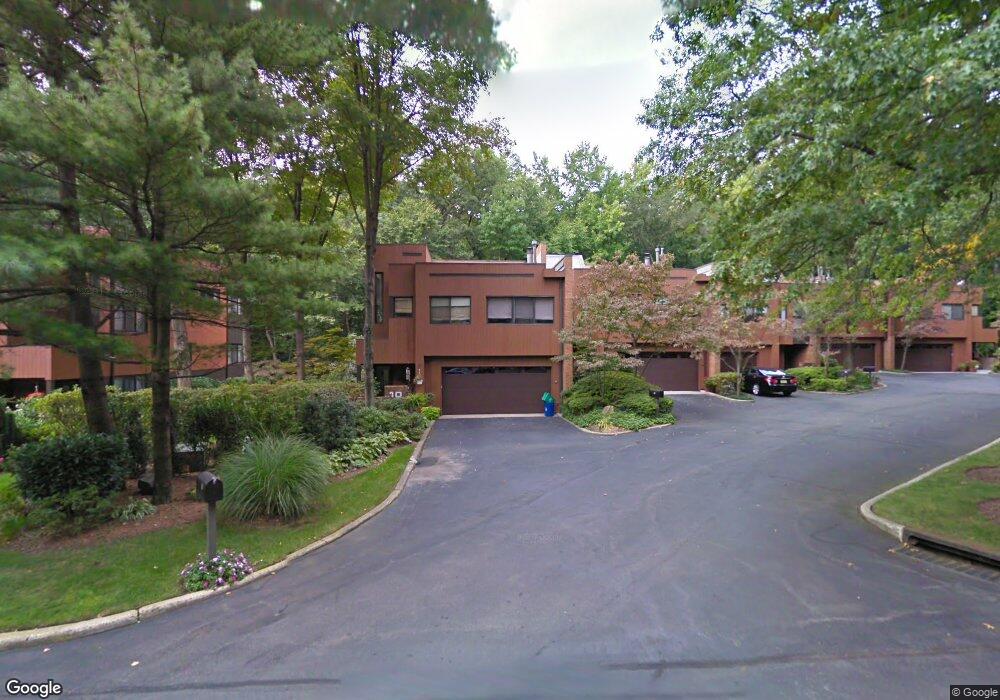
10 Daniel Dr Englewood, NJ 07631
Estimated Value: $1,041,520 - $1,353,000
--
Bed
--
Bath
2,278
Sq Ft
$523/Sq Ft
Est. Value
About This Home
This home is located at 10 Daniel Dr, Englewood, NJ 07631 and is currently estimated at $1,191,130, approximately $522 per square foot. 10 Daniel Dr is a home located in Bergen County with nearby schools including Dr J Grieco Elementary School, Dr Mccloud Elementary School, and J.E. Dismus Middle School.
Ownership History
Date
Name
Owned For
Owner Type
Purchase Details
Closed on
Nov 30, 2012
Sold by
Godfrey William K and Godfrey Barbara
Bought by
Kim Changsoo and Kim Hyesun
Current Estimated Value
Home Financials for this Owner
Home Financials are based on the most recent Mortgage that was taken out on this home.
Original Mortgage
$412,700
Outstanding Balance
$287,678
Interest Rate
3.5%
Mortgage Type
New Conventional
Estimated Equity
$903,452
Create a Home Valuation Report for This Property
The Home Valuation Report is an in-depth analysis detailing your home's value as well as a comparison with similar homes in the area
Home Values in the Area
Average Home Value in this Area
Purchase History
| Date | Buyer | Sale Price | Title Company |
|---|---|---|---|
| Kim Changsoo | $635,000 | -- |
Source: Public Records
Mortgage History
| Date | Status | Borrower | Loan Amount |
|---|---|---|---|
| Open | Kim Changsoo | $412,700 |
Source: Public Records
Tax History Compared to Growth
Tax History
| Year | Tax Paid | Tax Assessment Tax Assessment Total Assessment is a certain percentage of the fair market value that is determined by local assessors to be the total taxable value of land and additions on the property. | Land | Improvement |
|---|---|---|---|---|
| 2025 | $19,163 | $623,600 | $415,000 | $208,600 |
| 2024 | $18,583 | $623,600 | $415,000 | $208,600 |
| 2023 | $18,390 | $623,600 | $415,000 | $208,600 |
| 2022 | $18,390 | $623,600 | $415,000 | $208,600 |
| 2021 | $18,022 | $623,600 | $415,000 | $208,600 |
| 2020 | $17,554 | $623,600 | $415,000 | $208,600 |
| 2019 | $17,392 | $623,600 | $415,000 | $208,600 |
| 2018 | $16,974 | $623,600 | $415,000 | $208,600 |
| 2017 | $16,469 | $623,600 | $415,000 | $208,600 |
| 2016 | $15,945 | $623,600 | $415,000 | $208,600 |
| 2015 | $15,808 | $623,600 | $415,000 | $208,600 |
| 2014 | $15,677 | $623,600 | $415,000 | $208,600 |
Source: Public Records
Map
Nearby Homes