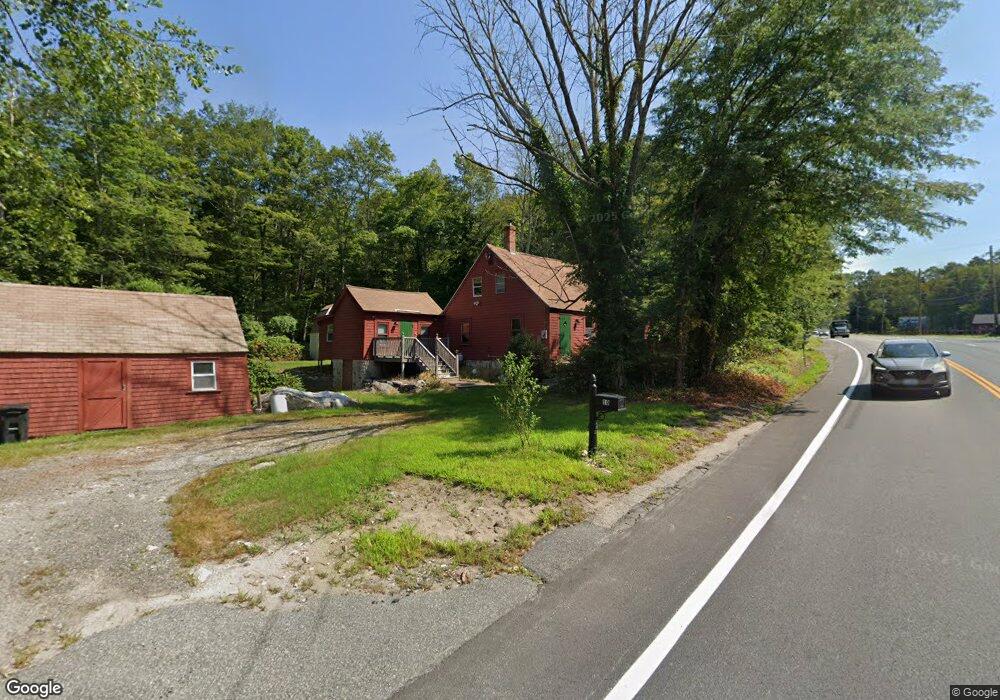
10 Danielson Pike Unit A Foster, RI 02825
Estimated Value: $286,000 - $403,239
2
Beds
1
Bath
2,450
Sq Ft
$131/Sq Ft
Est. Value
About This Home
This home is located at 10 Danielson Pike Unit A, Foster, RI 02825 and is currently estimated at $319,810, approximately $130 per square foot. 10 Danielson Pike Unit A is a home located in Providence County with nearby schools including Capt. Isaac Paine El. School, Ponaganset Middle School, and Ponaganset High School.
Ownership History
Date
Name
Owned For
Owner Type
Purchase Details
Closed on
Feb 11, 2025
Sold by
Matthews Charlene and Johnson Fern
Bought by
Lemoi Eric
Current Estimated Value
Home Financials for this Owner
Home Financials are based on the most recent Mortgage that was taken out on this home.
Original Mortgage
$228,000
Outstanding Balance
$226,248
Interest Rate
6.91%
Mortgage Type
Purchase Money Mortgage
Estimated Equity
$93,562
Purchase Details
Closed on
Dec 8, 2021
Sold by
Johnson Vincent I
Bought by
Matthews Charlene and Johnson Fern
Purchase Details
Closed on
Jul 18, 1989
Sold by
Hodgkinson Dennis R
Bought by
Izzo James J
Home Financials for this Owner
Home Financials are based on the most recent Mortgage that was taken out on this home.
Original Mortgage
$100,000
Interest Rate
10.39%
Mortgage Type
Purchase Money Mortgage
Create a Home Valuation Report for This Property
The Home Valuation Report is an in-depth analysis detailing your home's value as well as a comparison with similar homes in the area
Home Values in the Area
Average Home Value in this Area
Purchase History
| Date | Buyer | Sale Price | Title Company |
|---|---|---|---|
| Lemoi Eric | $285,000 | None Available | |
| Lemoi Eric | $285,000 | None Available | |
| Lemoi Eric | $285,000 | None Available | |
| Matthews Charlene | -- | None Available | |
| Matthews Charlene | -- | None Available | |
| Izzo James J | $30,000 | -- |
Source: Public Records
Mortgage History
| Date | Status | Borrower | Loan Amount |
|---|---|---|---|
| Open | Lemoi Eric | $228,000 | |
| Closed | Lemoi Eric | $228,000 | |
| Previous Owner | Izzo James J | $350,000 | |
| Previous Owner | Izzo James J | $70,000 | |
| Previous Owner | Izzo James J | $100,000 |
Source: Public Records
Tax History Compared to Growth
Tax History
| Year | Tax Paid | Tax Assessment Tax Assessment Total Assessment is a certain percentage of the fair market value that is determined by local assessors to be the total taxable value of land and additions on the property. | Land | Improvement |
|---|---|---|---|---|
| 2024 | $7,184 | $344,900 | $107,600 | $237,300 |
| 2023 | $4,908 | $216,500 | $82,800 | $133,700 |
| 2022 | $4,754 | $216,500 | $82,800 | $133,700 |
| 2021 | $4,620 | $216,500 | $82,800 | $133,700 |
| 2020 | $4,651 | $195,500 | $72,000 | $123,500 |
| 2018 | $4,465 | $195,500 | $72,000 | $123,500 |
| 2017 | $4,541 | $195,300 | $72,000 | $123,300 |
| 2015 | $4,183 | $195,300 | $72,000 | $123,300 |
| 2014 | $1,518 | $192,500 | $72,000 | $120,500 |
Source: Public Records
Map
Nearby Homes
- 0 Danielson Pike Unit 1347736
- 1101 Danielson Pike
- 2 Winsor
- 1240 Hartford Pike
- 1224 Hartford Pike
- 0 Central Pike
- 54 Central Pike
- 955 Chopmist Hill Rd
- 399 Bungy Rd
- 15 Apple Hill Dr
- 785 Danielson Pike
- 737 Danielson Pike
- 0 Stone Dam Rd
- 47 Hartford Pike
- 3 Wetherbee Rd
- 18 King Rd
- 6 North Rd
- 278 Central Pike
- 261 Quaker Ln
- 255 Rockland Rd
- 10 Danielson Pike
- 10 Danielson Pike
- 10B Danielson Pike
- 9 Danielson Pike
- 11 Danielson Pike
- 7 Danielson Pike
- 6 Danielson Pike
- 0 Danielson Pike Unit 635967
- 0 Danielson Pike Unit 9192
- 0 Danielson Pike Unit 651482
- 0 Danielson Pike Unit 218222
- 0 Danielson Pike Unit 540552
- 0 Danielson Pike Unit 811881
- 0 Danielson Pike Unit 414214
- 0 Danielson Pike Unit 662561
- 0 Danielson Pike Unit 419475
- 0 Danielson Pike Unit 1325221
- 0 Danielson Pike Unit 1324166
- 0 Danielson Pike Unit 832221
- 0 Danielson Pike Unit 854775