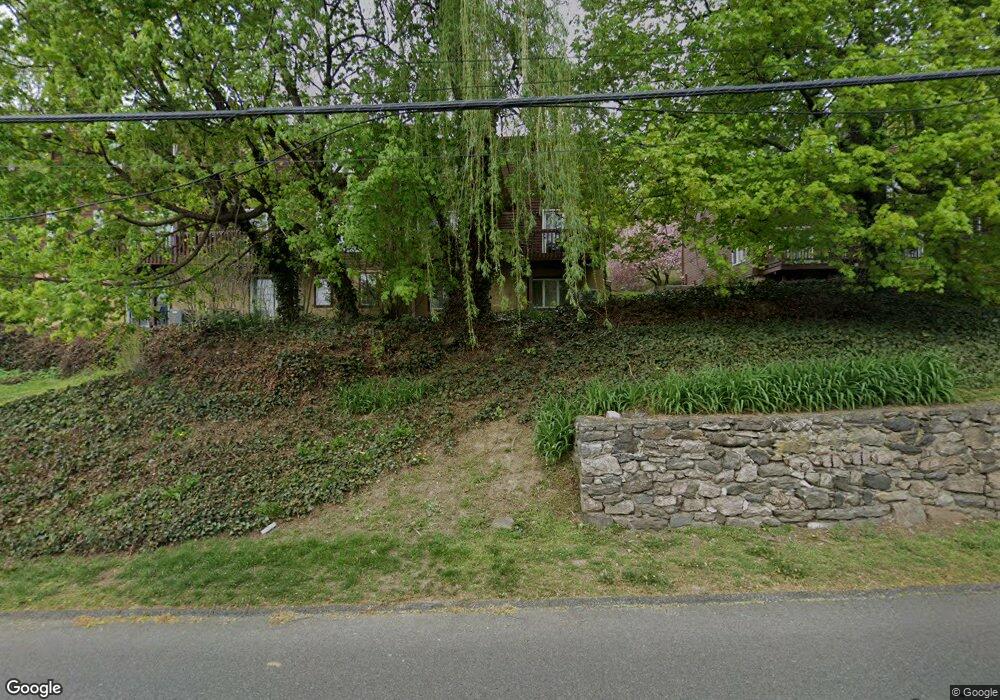
10 Davids Ln Ossining, NY 10562
Estimated Value: $467,745 - $479,000
1
Bed
1
Bath
1,452
Sq Ft
$326/Sq Ft
Est. Value
About This Home
This home is located at 10 Davids Ln, Ossining, NY 10562 and is currently estimated at $473,248, approximately $325 per square foot. 10 Davids Ln is a home located in Westchester County with nearby schools including Park School, Claremont School, and Roosevelt Elementary School.
Ownership History
Date
Name
Owned For
Owner Type
Purchase Details
Closed on
Aug 20, 2007
Sold by
Munoz Theresa
Bought by
Colsey Kristin D
Current Estimated Value
Purchase Details
Closed on
Feb 13, 2001
Sold by
Padilla Wanda
Bought by
Sarofeen John G
Home Financials for this Owner
Home Financials are based on the most recent Mortgage that was taken out on this home.
Original Mortgage
$128,250
Interest Rate
6.96%
Mortgage Type
Purchase Money Mortgage
Purchase Details
Closed on
Jun 9, 1999
Sold by
Bowles Lalena and Arango Wilmar
Bought by
Padilla Wanda
Home Financials for this Owner
Home Financials are based on the most recent Mortgage that was taken out on this home.
Original Mortgage
$111,150
Interest Rate
7.19%
Mortgage Type
Purchase Money Mortgage
Purchase Details
Closed on
Aug 2, 1996
Sold by
Scarpino David and Scarpino Diane
Bought by
Lappell David A and Lappell Catriona
Create a Home Valuation Report for This Property
The Home Valuation Report is an in-depth analysis detailing your home's value as well as a comparison with similar homes in the area
Home Values in the Area
Average Home Value in this Area
Purchase History
| Date | Buyer | Sale Price | Title Company |
|---|---|---|---|
| Colsey Kristin D | $325,000 | Fidelity Title Ltd | |
| Sarofeen John G | $142,500 | Ceo Title Agency Inc | |
| Padilla Wanda | $117,000 | Chicago Title Insurance Co | |
| Lappell David A | $175,000 | Chicago Title Insurance Co |
Source: Public Records
Mortgage History
| Date | Status | Borrower | Loan Amount |
|---|---|---|---|
| Previous Owner | Sarofeen John G | $128,250 | |
| Previous Owner | Padilla Wanda | $111,150 |
Source: Public Records
Tax History
| Year | Tax Paid | Tax Assessment Tax Assessment Total Assessment is a certain percentage of the fair market value that is determined by local assessors to be the total taxable value of land and additions on the property. | Land | Improvement |
|---|---|---|---|---|
| 2024 | $8,747 | $322,400 | $96,900 | $225,500 |
| 2023 | $8,164 | $304,500 | $96,900 | $207,600 |
| 2022 | $2,005 | $271,200 | $96,900 | $174,300 |
| 2021 | $6,463 | $237,900 | $96,900 | $141,000 |
| 2020 | $4,902 | $237,900 | $96,900 | $141,000 |
| 2019 | $7,326 | $225,900 | $96,900 | $129,000 |
| 2018 | $1,132 | $225,900 | $96,900 | $129,000 |
| 2017 | $3,397 | $213,100 | $96,900 | $116,200 |
| 2016 | $60,998 | $213,100 | $96,900 | $116,200 |
| 2015 | $5,555 | $13,300 | $2,100 | $11,200 |
| 2014 | $5,555 | $13,300 | $2,100 | $11,200 |
| 2013 | $5,555 | $13,300 | $2,100 | $11,200 |
Source: Public Records
Map
Nearby Homes
- 23 Liberty St
- 1 Agate Ave
- 312A Spring St
- 42 Charter Cir Unit 42
- 84 Charter Cir Unit 84
- 22 Lafayette Ave
- 123 S Highland Ave Unit B3
- 129 S Highland Ave Unit 6A
- 16 Rockledge Ave Unit 6K-2
- 16 Rockledge Ave Unit 5L2
- 605 Kemeys Ave Unit 605
- 117 S Highland Ave Unit L2
- 121 S Highland Ave Unit 5F
- 121 S Highland Ave Unit 5J
- 121 S Highland Ave Unit 6L
- 121 S Highland Ave Unit 6K
- 504 Kemeys Cove Unit 5-04
- 39 Washington Ave
- 39 Hamilton Ave
- 155 Revolutionary Rd
Your Personal Tour Guide
Ask me questions while you tour the home.