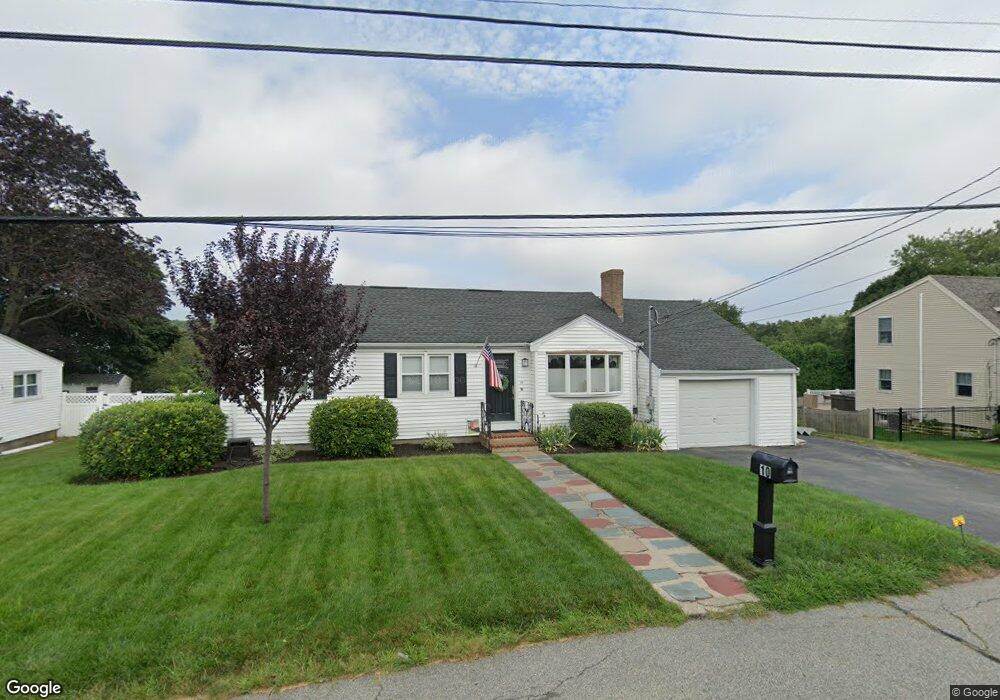
10 Day Cir Woburn, MA 01801
Shakerhill NeighborhoodEstimated Value: $671,000 - $758,000
3
Beds
2
Baths
1,874
Sq Ft
$386/Sq Ft
Est. Value
About This Home
This home is located at 10 Day Cir, Woburn, MA 01801 and is currently estimated at $724,135, approximately $386 per square foot. 10 Day Cir is a home located in Middlesex County with nearby schools including Reeves Elementary School, Daniel L. Joyce Middle School, and Woburn High School.
Ownership History
Date
Name
Owned For
Owner Type
Purchase Details
Closed on
May 2, 2023
Sold by
Cullen Arlene F and Cullen Donald E
Bought by
Arlene F & D E Cullen Ft and Cullen
Current Estimated Value
Purchase Details
Closed on
Jan 12, 2021
Sold by
Cullen Arlene F
Bought by
Arlene E & D E Cullen Ft and Cullen
Purchase Details
Closed on
Sep 22, 2003
Sold by
Lane Arlene F and Lane Michael E
Bought by
Lane Arlene F
Purchase Details
Closed on
May 1, 1985
Bought by
Lane Arlene F
Create a Home Valuation Report for This Property
The Home Valuation Report is an in-depth analysis detailing your home's value as well as a comparison with similar homes in the area
Home Values in the Area
Average Home Value in this Area
Purchase History
| Date | Buyer | Sale Price | Title Company |
|---|---|---|---|
| Arlene F & D E Cullen Ft | -- | None Available | |
| Arlene F & D E Cullen Ft | -- | None Available | |
| Arlene E & D E Cullen Ft | -- | None Available | |
| Arlene E & D E Cullen Ft | -- | None Available | |
| Lane Arlene F | -- | -- | |
| Lane Arlene F | -- | -- | |
| Lane Arlene F | $60,000 | -- |
Source: Public Records
Mortgage History
| Date | Status | Borrower | Loan Amount |
|---|---|---|---|
| Previous Owner | Lane Arlene F | $185,000 | |
| Previous Owner | Lane Arlene F | $230,500 | |
| Previous Owner | Lane Arlene F | $61,500 |
Source: Public Records
Tax History Compared to Growth
Tax History
| Year | Tax Paid | Tax Assessment Tax Assessment Total Assessment is a certain percentage of the fair market value that is determined by local assessors to be the total taxable value of land and additions on the property. | Land | Improvement |
|---|---|---|---|---|
| 2025 | $5,173 | $605,700 | $361,500 | $244,200 |
| 2024 | $4,743 | $588,500 | $344,300 | $244,200 |
| 2023 | $4,776 | $549,000 | $313,000 | $236,000 |
| 2022 | $4,638 | $496,600 | $272,200 | $224,400 |
| 2021 | $4,397 | $471,300 | $259,300 | $212,000 |
| 2020 | $4,162 | $446,600 | $259,300 | $187,300 |
| 2019 | $3,976 | $418,500 | $246,900 | $171,600 |
| 2018 | $3,776 | $381,800 | $226,500 | $155,300 |
| 2017 | $3,641 | $366,300 | $215,700 | $150,600 |
| 2016 | $3,470 | $345,300 | $201,600 | $143,700 |
| 2015 | $3,330 | $327,400 | $188,400 | $139,000 |
| 2014 | $3,199 | $306,400 | $188,400 | $118,000 |
Source: Public Records
Map
Nearby Homes
- 212 Cambridge Rd
- 192 Lexington St
- 185 Lexington St
- 9 Pond Terrace
- 123 Cambridge Rd Unit 4
- 273 Cambridge Rd Unit 202
- 269 Cambridge Rd Unit 203
- 7 Wainwright Rd Unit 118
- 7 Locust St
- 36 Cambridge Rd Unit 40
- 14 Saw Mill Brook Way
- 20 Amberwood Dr
- 68 Hammond Place Unit 68
- 31 Arlington Rd Unit 1-6
- 18 Beacon St Unit 18
- 29 Arlington Rd Unit 4
- 2 Howard Ct
- 14 Liana St
- 27 Arlington Rd Unit 1-6
- 19 Hammond Place Unit 19