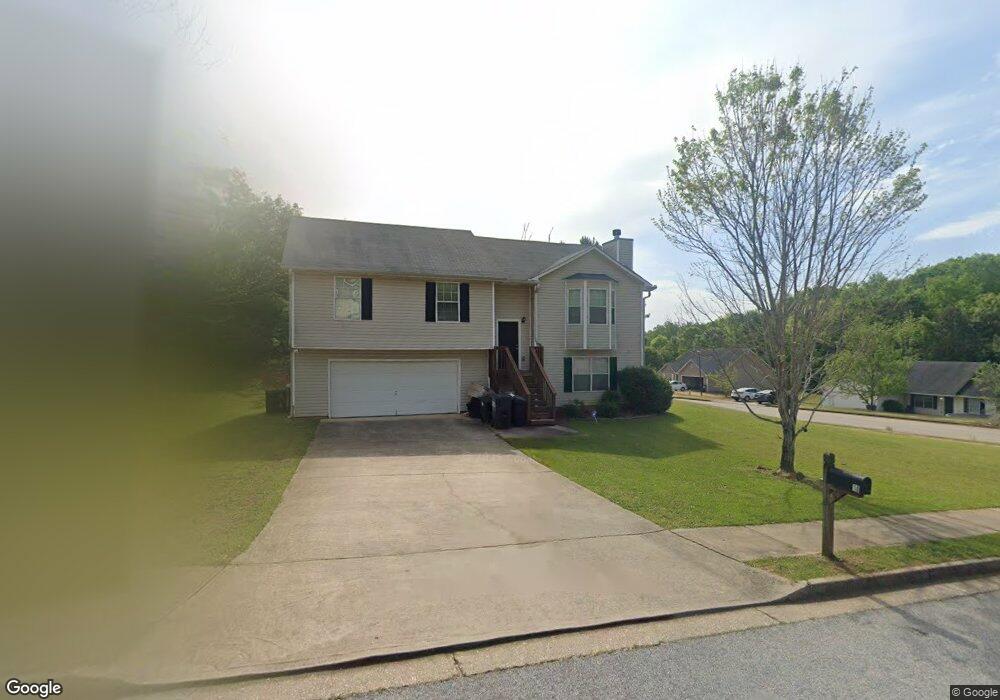
10 Dayton Way Covington, GA 30016
Estimated Value: $243,000 - $275,000
5
Beds
3
Baths
1,918
Sq Ft
$136/Sq Ft
Est. Value
About This Home
This home is located at 10 Dayton Way, Covington, GA 30016 and is currently estimated at $260,029, approximately $135 per square foot. 10 Dayton Way is a home located in Newton County with nearby schools including South Salem Elementary School, Liberty Middle School, and Alcovy High School.
Ownership History
Date
Name
Owned For
Owner Type
Purchase Details
Closed on
May 9, 2017
Sold by
Not Provided
Bought by
Srp Sub Llc
Current Estimated Value
Purchase Details
Closed on
May 6, 2014
Sold by
James Derrick
Bought by
Beauly Llc
Purchase Details
Closed on
Oct 29, 2009
Sold by
Lakeshore Trust Inc
Bought by
James Derrick
Home Financials for this Owner
Home Financials are based on the most recent Mortgage that was taken out on this home.
Original Mortgage
$82,478
Interest Rate
5.01%
Mortgage Type
FHA
Purchase Details
Closed on
May 27, 2009
Sold by
Hud & Housing Of Urban Dev
Bought by
Lakeshore Trust Inc
Purchase Details
Closed on
Jun 3, 2008
Sold by
Taylor Bean & Whitaker Mtg Cor
Bought by
Hud & Housing Of Urban Dev
Purchase Details
Closed on
Nov 21, 2006
Sold by
Kb Kay Bldrs Corp
Bought by
Wright Paul
Home Financials for this Owner
Home Financials are based on the most recent Mortgage that was taken out on this home.
Original Mortgage
$150,636
Interest Rate
6.36%
Mortgage Type
FHA
Create a Home Valuation Report for This Property
The Home Valuation Report is an in-depth analysis detailing your home's value as well as a comparison with similar homes in the area
Home Values in the Area
Average Home Value in this Area
Purchase History
| Date | Buyer | Sale Price | Title Company |
|---|---|---|---|
| Srp Sub Llc | -- | -- | |
| Beauly Llc | $68,500 | -- | |
| James Derrick | $84,000 | -- | |
| Lakeshore Trust Inc | -- | -- | |
| Hud & Housing Of Urban Dev | -- | -- | |
| Taylor Bean & Whitaker Mtg Cor | $166,212 | -- | |
| Wright Paul | $153,000 | -- |
Source: Public Records
Mortgage History
| Date | Status | Borrower | Loan Amount |
|---|---|---|---|
| Previous Owner | James Derrick | $82,478 | |
| Previous Owner | Wright Paul | $150,636 |
Source: Public Records
Tax History
| Year | Tax Paid | Tax Assessment Tax Assessment Total Assessment is a certain percentage of the fair market value that is determined by local assessors to be the total taxable value of land and additions on the property. | Land | Improvement |
|---|---|---|---|---|
| 2025 | $2,927 | $115,000 | $6,110 | $108,890 |
| 2024 | $2,978 | $115,000 | $6,110 | $108,890 |
| 2023 | $2,683 | $96,480 | $5,600 | $90,880 |
| 2022 | $1,901 | $67,640 | $5,600 | $62,040 |
| 2021 | $1,673 | $53,000 | $5,866 | $47,134 |
| 2020 | $1,844 | $53,000 | $5,014 | $47,986 |
| 2019 | $1,871 | $53,000 | $5,600 | $47,400 |
| 2018 | $658 | $36,480 | $5,000 | $31,480 |
| 2017 | $1,284 | $35,560 | $5,000 | $30,560 |
| 2016 | $1,184 | $32,640 | $5,000 | $27,640 |
| 2015 | $1,004 | $35,040 | $3,000 | $32,040 |
| 2014 | $973 | $30,440 | $0 | $0 |
Source: Public Records
Map
Nearby Homes
- 711 Highway 162
- 195 Twin Lakes Dr
- 55 Twin Lakes Dr
- 215 Morningside Dr
- 0 Roseberry Rd
- 0 Tempie Ln
- 14 Highway 162
- 10 Barberry Cir
- 15 Jackson Rd
- 0 Spring Hill Dr Unit 7725409
- 0 Spring Hill Dr Unit 10699182
- 0 Eleanor Dr Unit 10443925
- 240 Harville Rd
- 220 Harville Rd
- 10 Heaton Dr
- 35 Knights Cir
- 125 Shelby Oaks Trail
- 60 Knights Cir
- 85 Austin Terrace Unit LOT 45
- 15 Lisa Ct
- 20 Dayton Way
- 245 Green Commons Dr
- 245 Green Commons Dr Unit 70
- 255 Green Commons Dr
- 230 Green Commons Dr
- 235 Green Commons Dr
- 30 Dayton Way
- 15 Dayton Way
- 220 Green Commons Dr
- 225 Green Commons Dr
- 40 Dayton Way
- 25 Dayton Way
- 265 Green Commons Dr
- 285 Green Commons Dr
- 210 Green Commons Dr
- 275 Green Commons Dr
- 50 Dayton Way
- 215 Green Commons Dr
- 35 Dayton Way
- 60 Dayton Way
Your Personal Tour Guide
Ask me questions while you tour the home.