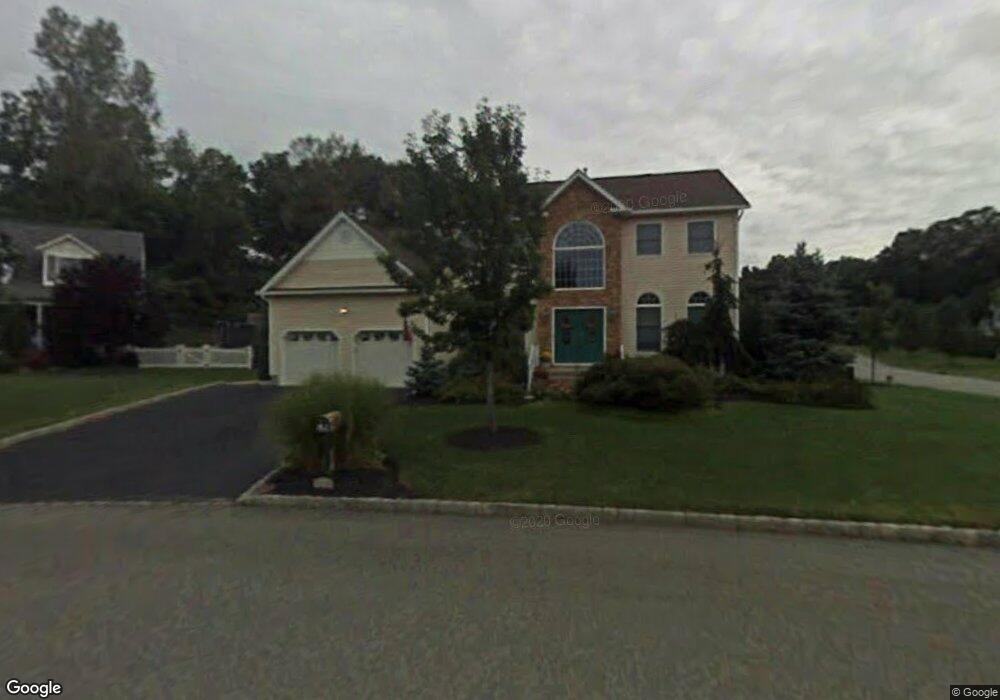
10 Delongis Ct Sparkill, NY 10976
Estimated Value: $941,000 - $1,027,001
4
Beds
4
Baths
2,792
Sq Ft
$353/Sq Ft
Est. Value
About This Home
This home is located at 10 Delongis Ct, Sparkill, NY 10976 and is currently estimated at $985,500, approximately $352 per square foot. 10 Delongis Ct is a home located in Rockland County with nearby schools including William O Schaefer Elementary School, Cottage Lane Elementary School, and South Orangetown Middle School.
Ownership History
Date
Name
Owned For
Owner Type
Purchase Details
Closed on
Mar 7, 2022
Sold by
Thampi Jibin P and Mathew Binu
Bought by
Mathew Binu
Current Estimated Value
Home Financials for this Owner
Home Financials are based on the most recent Mortgage that was taken out on this home.
Original Mortgage
$14,785
Outstanding Balance
$14,173
Interest Rate
6.65%
Mortgage Type
New Conventional
Estimated Equity
$971,327
Purchase Details
Closed on
Jan 30, 2012
Sold by
Glielmi Richard
Bought by
Thampi Jibin P and Mathew Binu
Home Financials for this Owner
Home Financials are based on the most recent Mortgage that was taken out on this home.
Original Mortgage
$565,297
Outstanding Balance
$388,028
Interest Rate
3.93%
Mortgage Type
FHA
Estimated Equity
$597,472
Create a Home Valuation Report for This Property
The Home Valuation Report is an in-depth analysis detailing your home's value as well as a comparison with similar homes in the area
Home Values in the Area
Average Home Value in this Area
Purchase History
| Date | Buyer | Sale Price | Title Company |
|---|---|---|---|
| Mathew Binu | -- | None Available | |
| Thampi Jibin P | $605,000 | The Judicial Title Insurance |
Source: Public Records
Mortgage History
| Date | Status | Borrower | Loan Amount |
|---|---|---|---|
| Open | Mathew Binu | $14,785 | |
| Open | Thampi Jibin P | $565,297 |
Source: Public Records
Tax History Compared to Growth
Tax History
| Year | Tax Paid | Tax Assessment Tax Assessment Total Assessment is a certain percentage of the fair market value that is determined by local assessors to be the total taxable value of land and additions on the property. | Land | Improvement |
|---|---|---|---|---|
| 2024 | $22,643 | $295,200 | $69,700 | $225,500 |
| 2023 | $22,643 | $295,200 | $69,700 | $225,500 |
| 2022 | $8,466 | $295,200 | $69,700 | $225,500 |
| 2021 | $18,289 | $295,200 | $69,700 | $225,500 |
| 2020 | $20,025 | $295,200 | $69,700 | $225,500 |
| 2019 | $7,722 | $295,200 | $69,700 | $225,500 |
| 2018 | $17,848 | $295,200 | $69,700 | $225,500 |
| 2017 | $17,279 | $295,200 | $69,700 | $225,500 |
| 2016 | $16,764 | $295,200 | $69,700 | $225,500 |
| 2015 | -- | $295,200 | $69,700 | $225,500 |
| 2014 | -- | $295,200 | $69,700 | $225,500 |
Source: Public Records
Map
Nearby Homes
- 26 Van Terrace
- 450 Valentine Ave
- 8 Haring Ave
- 4 Deer Run
- 414 Kings Hwy
- 12 Blair Ct
- 9 Lawrence St
- 3 W Lawrence Park Dr Unit 1
- 1 W Lawrence Park Dr Unit 10
- 210 Ferdon Ave
- 215 Washington St Unit 19
- 516 Oak Tree Rd
- 173 Oak Tree Rd
- 272 Piermont Ave
- 141 Washington Spring Rd
- 115 Greenbush Rd
- 78 Main St
- 613 Route 9w
- 52 Broadway
- 199 Tweed Blvd
- 8 Delongis Ct
- 12 Delongis Ct
- 50 Delongis Ct
- 6 Delongis Ct
- 48 Delongis Ct
- 45 Delongis Ct
- 14 Delongis Ct
- 52 Delongis Ct
- 4 Delongis Ct
- 46 Delongis Ct
- 41 Delongis Ct
- 15 Delongis Ct
- 16 Delongis Ct
- 510 Washington St
- 540 Washington St
- 44 Delongis Ct
- 490 Washington St
- 2 Delongis Ct
- 18 Delongis Ct
- 39 Delongis Ct