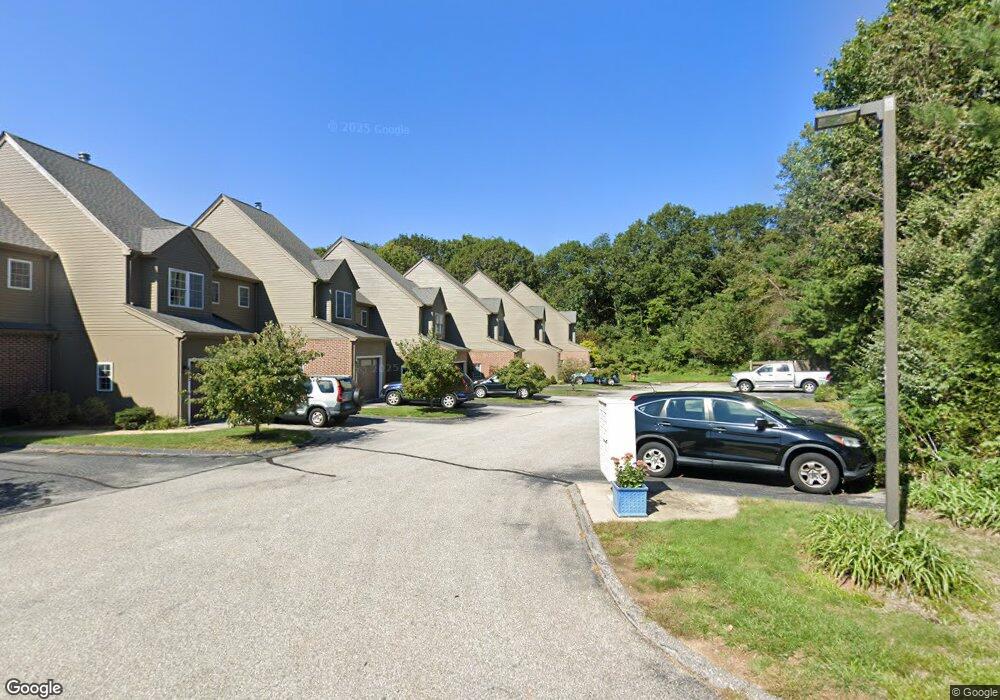
10 Depot Rd Unit 3 Willington, CT 06279
Estimated Value: $278,000 - $352,000
2
Beds
3
Baths
1,464
Sq Ft
$218/Sq Ft
Est. Value
About This Home
This home is located at 10 Depot Rd Unit 3, Willington, CT 06279 and is currently estimated at $319,297, approximately $218 per square foot. 10 Depot Rd Unit 3 is a home located in Tolland County with nearby schools including Center Elementary School, Hall Memorial School, and E.O. Smith High School.
Ownership History
Date
Name
Owned For
Owner Type
Purchase Details
Closed on
Sep 17, 2020
Sold by
Boggis Joshua and Boggis Renee
Bought by
Troiano Jenny M
Current Estimated Value
Home Financials for this Owner
Home Financials are based on the most recent Mortgage that was taken out on this home.
Original Mortgage
$149,494
Outstanding Balance
$132,420
Interest Rate
2.8%
Mortgage Type
New Conventional
Estimated Equity
$186,877
Purchase Details
Closed on
Jun 3, 2002
Sold by
Johnson Kenneth
Bought by
Bacchiochi Renee and Boggis Joshua
Home Financials for this Owner
Home Financials are based on the most recent Mortgage that was taken out on this home.
Original Mortgage
$148,482
Interest Rate
7%
Purchase Details
Closed on
May 30, 1997
Sold by
Collier Andrew Graham and Collier Judee
Bought by
Johnson Kenneth
Create a Home Valuation Report for This Property
The Home Valuation Report is an in-depth analysis detailing your home's value as well as a comparison with similar homes in the area
Home Values in the Area
Average Home Value in this Area
Purchase History
| Date | Buyer | Sale Price | Title Company |
|---|---|---|---|
| Troiano Jenny M | $148,000 | None Available | |
| Troiano Jenny M | $148,000 | None Available | |
| Bacchiochi Renee | $151,900 | -- | |
| Bacchiochi Renee | $151,900 | -- | |
| Johnson Kenneth | $111,000 | -- | |
| Johnson Kenneth | $111,000 | -- |
Source: Public Records
Mortgage History
| Date | Status | Borrower | Loan Amount |
|---|---|---|---|
| Open | Troiano Jenny M | $149,494 | |
| Closed | Troiano Jenny M | $149,494 | |
| Previous Owner | Johnson Kenneth | $148,482 |
Source: Public Records
Tax History Compared to Growth
Tax History
| Year | Tax Paid | Tax Assessment Tax Assessment Total Assessment is a certain percentage of the fair market value that is determined by local assessors to be the total taxable value of land and additions on the property. | Land | Improvement |
|---|---|---|---|---|
| 2025 | $3,886 | $152,870 | $0 | $152,870 |
| 2024 | $3,792 | $111,880 | $0 | $111,880 |
| 2023 | $3,598 | $111,880 | $0 | $111,880 |
| 2022 | $3,498 | $111,880 | $0 | $111,880 |
| 2021 | $3,355 | $111,880 | $0 | $111,880 |
| 2020 | $3,355 | $111,880 | $0 | $111,880 |
| 2019 | $3,366 | $111,880 | $0 | $111,880 |
| 2018 | $3,178 | $105,620 | $0 | $105,620 |
| 2017 | $3,178 | $105,620 | $0 | $105,620 |
| 2015 | $2,888 | $105,620 | $0 | $105,620 |
| 2014 | $2,888 | $105,620 | $0 | $105,620 |
Source: Public Records
Map
Nearby Homes
- 124 River Rd
- 39 Navratil Rd
- 25 Ridgewood Rd
- 527 Merrow Rd
- 0 Tolland Turnpike Unit 24107059
- 24 S River Rd
- 454 Merrow Rd
- 19 Thomas Dr
- 167 Baxter Rd
- 266 Willington Hill Rd
- 152 Cedar Swamp Rd
- 0 Tolland Stage Rd Unit 24101836
- 35 Fern Dr
- 20 Barlow Dr
- 28 Barlow Dr
- 22 Red Oak Hill Rd
- 312 Merrow Rd
- 317 Merrow Rd
- 284 Merrow Rd
- 48 Angela Dr
- 10 Depot Rd Unit 1001
- 10 Depot Rd Unit 17
- 10 Depot Rd Unit 33
- 10 Depot Rd Unit 34
- 10 Depot Rd Unit 29
- 10 Depot Rd Unit 24
- 10 Depot Rd
- 10 Depot Rd Unit 30
- 10 Depot Rd Unit 31
- 10 Depot Rd Unit 20
- 10 Depot Rd Unit 12
- 10 Depot Rd Unit 4
- 10 Depot Rd Unit 15
- 10 Depot Rd Unit 23
- 10 Depot Rd Unit 6
- 10 Depot Rd Unit 13
- 10 Depot Rd Unit 22
- 10 Depot Rd Unit 21
- 10 Depot Rd Unit 16
- 10 Depot Rd Unit 9