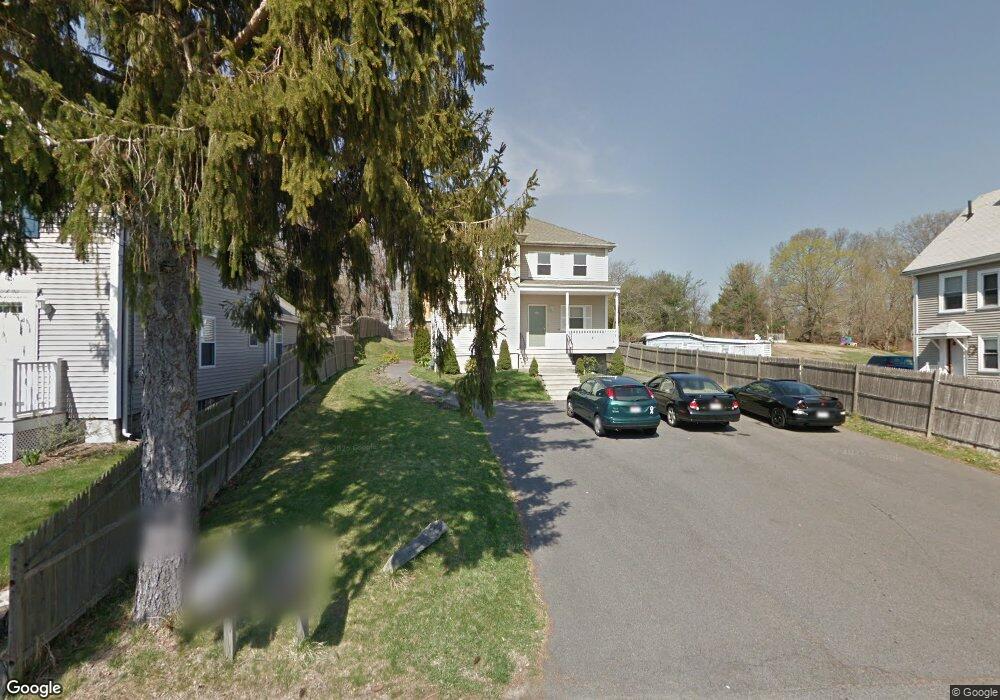
10 Dexter Ave Unit 2 Taunton, MA 02780
Estimated Value: $371,000 - $477,000
4
Beds
2
Baths
1,744
Sq Ft
$251/Sq Ft
Est. Value
About This Home
This home is located at 10 Dexter Ave Unit 2, Taunton, MA 02780 and is currently estimated at $437,199, approximately $250 per square foot. 10 Dexter Ave Unit 2 is a home located in Bristol County with nearby schools including Mulcahey Elementary School, Taunton High School, and Joseph H. Martin.
Ownership History
Date
Name
Owned For
Owner Type
Purchase Details
Closed on
May 1, 2013
Sold by
Norway Christiane and Norway Franklin
Bought by
Norway Christiane and Norway Franklin
Current Estimated Value
Purchase Details
Closed on
May 28, 2010
Sold by
Deutsche Bank Natl T C
Bought by
Norway Franklin and Ferreira Christine
Home Financials for this Owner
Home Financials are based on the most recent Mortgage that was taken out on this home.
Original Mortgage
$166,840
Interest Rate
5.13%
Mortgage Type
Purchase Money Mortgage
Purchase Details
Closed on
Dec 29, 2006
Sold by
Cappola William
Bought by
Hurt Darron and Mcwhorter Angela
Home Financials for this Owner
Home Financials are based on the most recent Mortgage that was taken out on this home.
Original Mortgage
$274,550
Interest Rate
6.29%
Mortgage Type
Purchase Money Mortgage
Create a Home Valuation Report for This Property
The Home Valuation Report is an in-depth analysis detailing your home's value as well as a comparison with similar homes in the area
Home Values in the Area
Average Home Value in this Area
Purchase History
| Date | Buyer | Sale Price | Title Company |
|---|---|---|---|
| Norway Christiane | -- | -- | |
| Norway Franklin | $172,000 | -- | |
| Norway Franklin | $172,000 | -- | |
| Hurt Darron | $289,000 | -- |
Source: Public Records
Mortgage History
| Date | Status | Borrower | Loan Amount |
|---|---|---|---|
| Previous Owner | Norway Franklin | $166,840 | |
| Previous Owner | Hurt Darron | $274,550 |
Source: Public Records
Tax History Compared to Growth
Tax History
| Year | Tax Paid | Tax Assessment Tax Assessment Total Assessment is a certain percentage of the fair market value that is determined by local assessors to be the total taxable value of land and additions on the property. | Land | Improvement |
|---|---|---|---|---|
| 2025 | $3,332 | $304,600 | $0 | $304,600 |
| 2024 | $3,359 | $300,200 | $0 | $300,200 |
| 2023 | $3,425 | $284,200 | $0 | $284,200 |
| 2022 | $3,270 | $248,100 | $0 | $248,100 |
| 2021 | $3,428 | $241,400 | $0 | $241,400 |
| 2020 | $3,329 | $224,000 | $0 | $224,000 |
| 2019 | $3,650 | $231,600 | $0 | $231,600 |
| 2018 | $3,575 | $227,400 | $0 | $227,400 |
| 2017 | $3,269 | $208,100 | $0 | $208,100 |
| 2016 | $3,197 | $203,900 | $0 | $203,900 |
| 2015 | $2,981 | $198,600 | $0 | $198,600 |
| 2014 | $2,902 | $198,600 | $0 | $198,600 |
Source: Public Records
Map
Nearby Homes
- 16 Billings St
- 450 Somerset Ave Unit 6-6
- 65 Bridget Dr
- 50 Highland St Unit 135
- 4 Lawton St Unit A
- 4 A Lawton St Unit A
- 58 Lawton St
- 90 E Water St
- 38 Cranesbill Rd
- 125 Highland St Unit 103
- 24 1st St
- LOT A Dwinell Rd
- 252 Somerset Ave
- 22 Everett St
- 4 Parkin Ct
- 513 Berkley St
- 1 Everett St
- 70 Landing Dr Unit 5-L
- 244 Pratt St Unit A
- 322 Dighton Ave
- 10 Dexter Ave Unit 1
- 10B Dexter Ave
- 10 Dexter Ave
- 10 Dexter Ave Unit A
- 10B Dexter Ave Unit B
- 8 Dexter Ave
- 12 Dexter Ave
- 7 Marvel St
- 7 Marvel St Unit 2
- 7 Highland St
- 11 Dexter Ave
- 9 Highland St
- 9 Dexter Ave
- 18 Dexter Ave
- 11 Highland St
- 5 Dexter Ave
- 13 Highland St
- LOT 13 Highland Heights
- 15 Highland St
- 2 Highland St