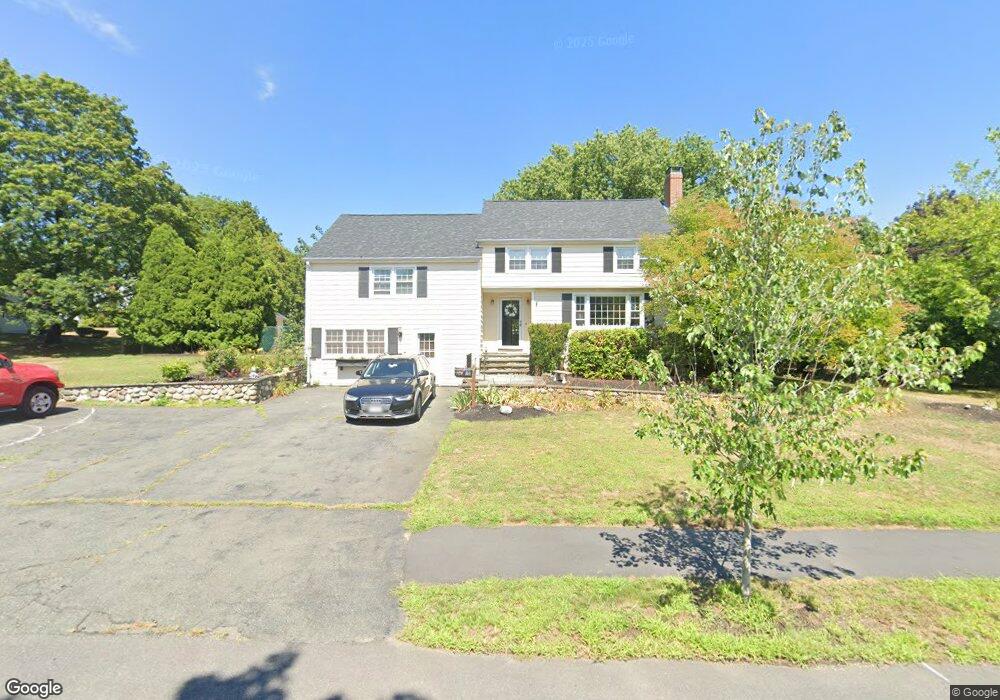
10 Drury Ln Danvers, MA 01923
Estimated Value: $889,000 - $1,040,000
5
Beds
3
Baths
2,719
Sq Ft
$343/Sq Ft
Est. Value
About This Home
This home is located at 10 Drury Ln, Danvers, MA 01923 and is currently estimated at $932,042, approximately $342 per square foot. 10 Drury Ln is a home located in Essex County with nearby schools including Danvers High School, St. Mary of the Annunciation School, and Plumfield Academy.
Ownership History
Date
Name
Owned For
Owner Type
Purchase Details
Closed on
Jun 15, 2005
Sold by
Powers Maureen P
Bought by
Farinelli William A and Farinelli Judith A
Current Estimated Value
Home Financials for this Owner
Home Financials are based on the most recent Mortgage that was taken out on this home.
Original Mortgage
$360,000
Outstanding Balance
$188,183
Interest Rate
5.78%
Mortgage Type
Purchase Money Mortgage
Estimated Equity
$743,859
Purchase Details
Closed on
Mar 24, 2005
Sold by
Powers Scott T and Powers Maureen P
Bought by
Powers Maureen P
Purchase Details
Closed on
Sep 12, 2003
Sold by
Powers Scott T
Bought by
Powers Scott T
Purchase Details
Closed on
Jul 31, 1998
Sold by
Conroy Stephen A and Conroy Ellen M
Bought by
Powers Scott T
Create a Home Valuation Report for This Property
The Home Valuation Report is an in-depth analysis detailing your home's value as well as a comparison with similar homes in the area
Home Values in the Area
Average Home Value in this Area
Purchase History
| Date | Buyer | Sale Price | Title Company |
|---|---|---|---|
| Farinelli William A | $470,000 | -- | |
| Powers Maureen P | -- | -- | |
| Powers Scott T | -- | -- | |
| Powers Scott T | $250,000 | -- |
Source: Public Records
Mortgage History
| Date | Status | Borrower | Loan Amount |
|---|---|---|---|
| Open | Powers Scott T | $178,000 | |
| Open | Powers Scott T | $360,000 |
Source: Public Records
Tax History Compared to Growth
Tax History
| Year | Tax Paid | Tax Assessment Tax Assessment Total Assessment is a certain percentage of the fair market value that is determined by local assessors to be the total taxable value of land and additions on the property. | Land | Improvement |
|---|---|---|---|---|
| 2025 | $8,107 | $737,700 | $384,800 | $352,900 |
| 2024 | $8,126 | $731,400 | $384,800 | $346,600 |
| 2023 | $7,784 | $662,500 | $349,700 | $312,800 |
| 2022 | $7,685 | $607,000 | $317,300 | $289,700 |
| 2021 | $7,393 | $553,800 | $300,500 | $253,300 |
| 2020 | $7,187 | $550,300 | $297,000 | $253,300 |
| 2019 | $6,805 | $512,400 | $270,000 | $242,400 |
| 2018 | $6,629 | $489,600 | $267,300 | $222,300 |
| 2017 | $6,252 | $440,600 | $233,600 | $207,000 |
| 2016 | $6,021 | $424,000 | $222,800 | $201,200 |
| 2015 | $5,737 | $384,800 | $202,500 | $182,300 |
Source: Public Records
Map
Nearby Homes
- 98 Newbury St Unit 4B
- 98 Newbury St Unit 18B
- 360 Andover St Unit 1310
- 96 Newbury St Unit 6B
- 103 Newbury St Unit 3
- 103 Newbury St Unit 1
- 2 Pat Dr
- 4 Briarwood Dr
- 286 Newbury St Unit 110
- 286 Newbury St Unit 52
- 37 Peaslee Cir Unit 37
- 261 Newbury St Unit 33B
- 261 Newbury St Unit 72C
- 252 Newbury St Unit 71
- 252 Newbury St Unit 1
- 251 Newbury St Unit 23
- 8 Brookside Rd
- 14 Bourbon St Unit 25
- 9 Ledgewood Way Unit 6
- 10 Ledgewood Way Unit 18