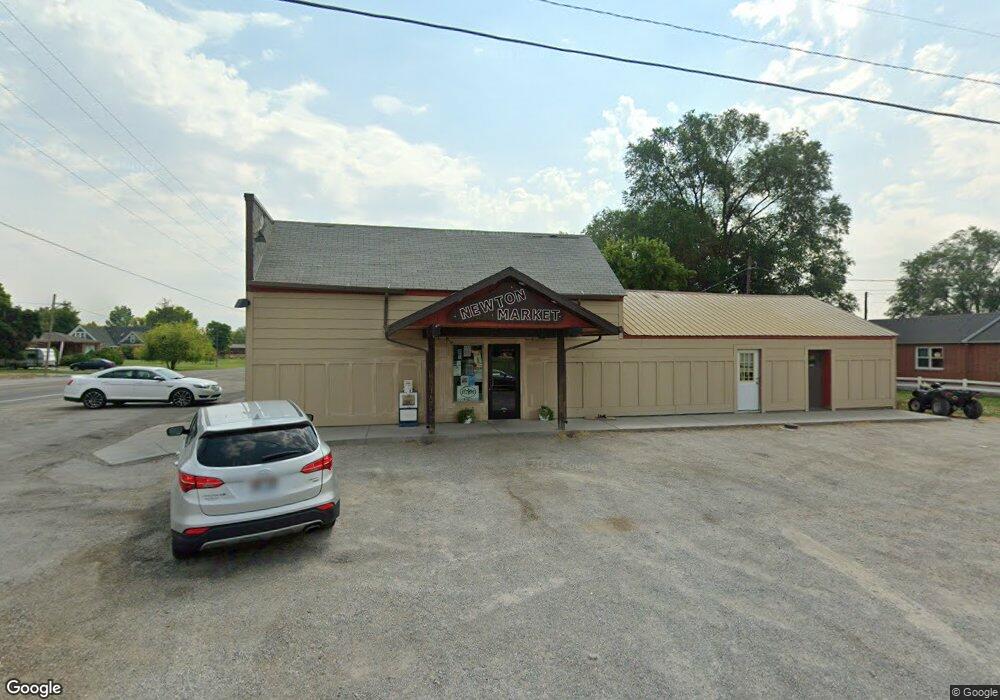
10 E Main Newton, UT 84327
Estimated Value: $508,000
Studio
--
Bath
5,184
Sq Ft
$98/Sq Ft
Est. Value
About This Home
This home is located at 10 E Main, Newton, UT 84327 and is currently estimated at $508,000, approximately $97 per square foot. 10 E Main is a home located in Cache County with nearby schools including Lewiston School, White Pine Middle School, and North Cache Middle School.
Ownership History
Date
Name
Owned For
Owner Type
Purchase Details
Closed on
Sep 28, 2010
Sold by
Griffin Cleon L
Bought by
Griffin Rebecca Anne
Current Estimated Value
Purchase Details
Closed on
Aug 27, 2010
Sold by
Griffin Rebecca Anne
Bought by
Newton Market Llc
Purchase Details
Closed on
Dec 14, 2005
Sold by
Pattton Diane B and The Ailen B Longacre Revocable
Bought by
Griffin Cleon L and Griffin Rebecca Ann
Home Financials for this Owner
Home Financials are based on the most recent Mortgage that was taken out on this home.
Original Mortgage
$15,000
Interest Rate
6.36%
Mortgage Type
Commercial
Purchase Details
Closed on
Jun 29, 2001
Sold by
Culmsee Aileen B and The Aileen B Culmsee Revocable
Bought by
Longacre Aileen B and Patton Diane B
Create a Home Valuation Report for This Property
The Home Valuation Report is an in-depth analysis detailing your home's value as well as a comparison with similar homes in the area
Purchase History
| Date | Buyer | Sale Price | Title Company |
|---|---|---|---|
| Griffin Rebecca Anne | -- | Hickman Land Title Company | |
| Newton Market Llc | -- | Hickman Land Title Company | |
| Griffin Cleon L | -- | Cache Title Company | |
| Griffin Rebecca Anne | -- | Cache Title Company | |
| Griffin Rebecca Ann | -- | Cache Title Company | |
| Longacre Aileen B | -- | -- |
Source: Public Records
Mortgage History
| Date | Status | Borrower | Loan Amount |
|---|---|---|---|
| Previous Owner | Griffin Rebecca Ann | $15,000 |
Source: Public Records
Tax History
| Year | Tax Paid | Tax Assessment Tax Assessment Total Assessment is a certain percentage of the fair market value that is determined by local assessors to be the total taxable value of land and additions on the property. | Land | Improvement |
|---|---|---|---|---|
| 2025 | $20 | $297,009 | $119,846 | $177,163 |
| 2024 | $1,837 | $245,414 | $61,034 | $184,380 |
| 2023 | $1,922 | $242,508 | $58,128 | $184,380 |
| 2022 | $1,990 | $239,740 | $55,360 | $184,380 |
| 2021 | $2,275 | $230,960 | $55,360 | $175,600 |
| 2020 | $2,434 | $230,960 | $55,360 | $175,600 |
| 2019 | $2,471 | $220,031 | $44,431 | $175,600 |
| 2018 | $1,185 | $104,631 | $44,431 | $60,200 |
| 2017 | $1,242 | $104,630 | $0 | $0 |
| 2016 | $1,258 | $104,630 | $0 | $0 |
| 2015 | $1,260 | $104,630 | $0 | $0 |
| 2014 | $1,223 | $103,880 | $0 | $0 |
| 2013 | -- | $103,880 | $0 | $0 |
Source: Public Records
Map
Nearby Homes
- 312 W 200 N Unit 10
- 222 W 200 N Unit 18
- 165 W 200 N
- 136 W 200 N Unit 21
- 244 W 200 N Unit 17
- 260 W 200 N Unit 16
- 158 W 200 N Unit 20
- 116 W 200 N Unit 22
- 362 W 200 N Unit 8
- 340 W 200 N Unit 9
- 115 N 100 W Unit 23
- 180 N 300 W
- 144 N 300 W Unit 13
- 141 N 300 W Unit 12
- 165 N 300 W Unit 11
- 172 N 300 W Unit 14
- 15 S 400 W
- 9000 N 6400 W
- 7900 N 5600 W
- 6953 W 6600 N Unit 3
Your Personal Tour Guide
Ask me questions while you tour the home.