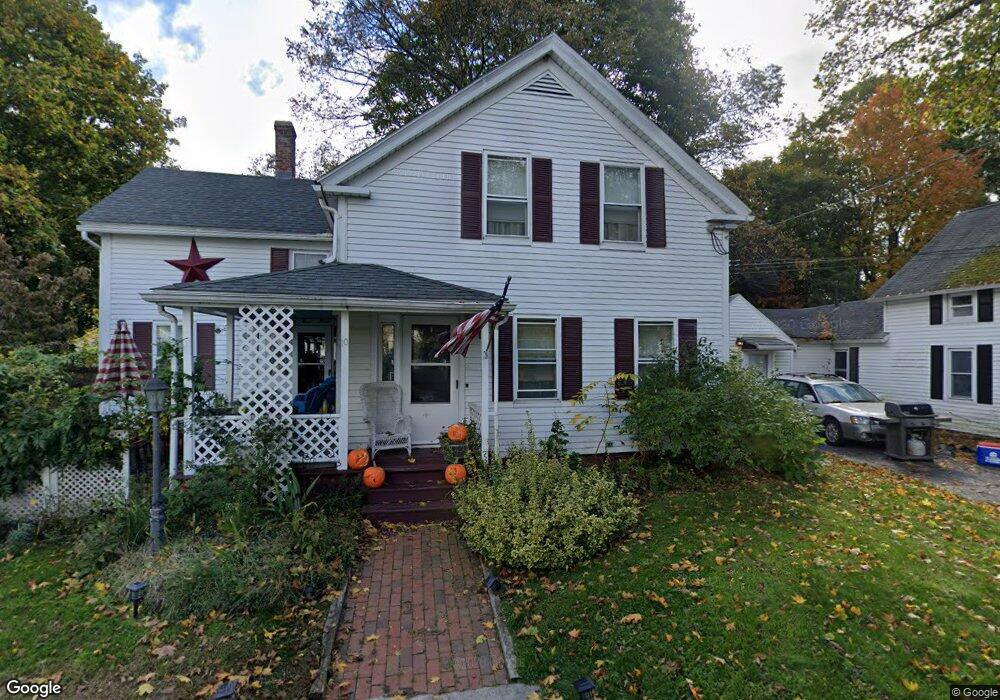
10 E Main St Oxford, MA 01540
Estimated Value: $387,000 - $497,000
3
Beds
2
Baths
1,582
Sq Ft
$264/Sq Ft
Est. Value
About This Home
This home is located at 10 E Main St, Oxford, MA 01540 and is currently estimated at $416,945, approximately $263 per square foot. 10 E Main St is a home located in Worcester County with nearby schools including Alfred M Chaffee, Oxford High School, and Clara Barton Elementary School.
Ownership History
Date
Name
Owned For
Owner Type
Purchase Details
Closed on
Apr 15, 2003
Sold by
Canelos Angela R
Bought by
Haskins Douglas P and Haskins Ramona E
Current Estimated Value
Home Financials for this Owner
Home Financials are based on the most recent Mortgage that was taken out on this home.
Original Mortgage
$195,940
Outstanding Balance
$84,854
Interest Rate
5.86%
Mortgage Type
Purchase Money Mortgage
Estimated Equity
$332,091
Purchase Details
Closed on
Jul 30, 2002
Sold by
Crouse Richard E and Crouse Myla
Bought by
Canelos Angela R
Home Financials for this Owner
Home Financials are based on the most recent Mortgage that was taken out on this home.
Original Mortgage
$151,900
Interest Rate
6.73%
Mortgage Type
Purchase Money Mortgage
Create a Home Valuation Report for This Property
The Home Valuation Report is an in-depth analysis detailing your home's value as well as a comparison with similar homes in the area
Home Values in the Area
Average Home Value in this Area
Purchase History
| Date | Buyer | Sale Price | Title Company |
|---|---|---|---|
| Haskins Douglas P | $202,000 | -- | |
| Canelos Angela R | $189,900 | -- |
Source: Public Records
Mortgage History
| Date | Status | Borrower | Loan Amount |
|---|---|---|---|
| Open | Canelos Angela R | $195,940 | |
| Previous Owner | Canelos Angela R | $151,900 | |
| Previous Owner | Canelos Angela R | $72,000 | |
| Previous Owner | Canelos Angela R | $46,000 |
Source: Public Records
Tax History
| Year | Tax Paid | Tax Assessment Tax Assessment Total Assessment is a certain percentage of the fair market value that is determined by local assessors to be the total taxable value of land and additions on the property. | Land | Improvement |
|---|---|---|---|---|
| 2025 | $41 | $322,200 | $81,400 | $240,800 |
| 2024 | $3,928 | $291,400 | $72,000 | $219,400 |
| 2023 | $3,931 | $288,200 | $64,300 | $223,900 |
| 2022 | $3,749 | $232,000 | $61,100 | $170,900 |
| 2021 | $3,501 | $211,800 | $58,000 | $153,800 |
| 2020 | $3,254 | $195,300 | $58,000 | $137,300 |
| 2019 | $2,905 | $170,600 | $58,000 | $112,600 |
| 2018 | $2,946 | $170,600 | $58,000 | $112,600 |
| 2017 | $2,966 | $176,000 | $58,000 | $118,000 |
| 2016 | $2,980 | $176,000 | $58,000 | $118,000 |
| 2015 | $2,779 | $176,000 | $58,000 | $118,000 |
| 2014 | $2,748 | $183,200 | $58,000 | $125,200 |
Source: Public Records
Map
Nearby Homes
Your Personal Tour Guide
Ask me questions while you tour the home.