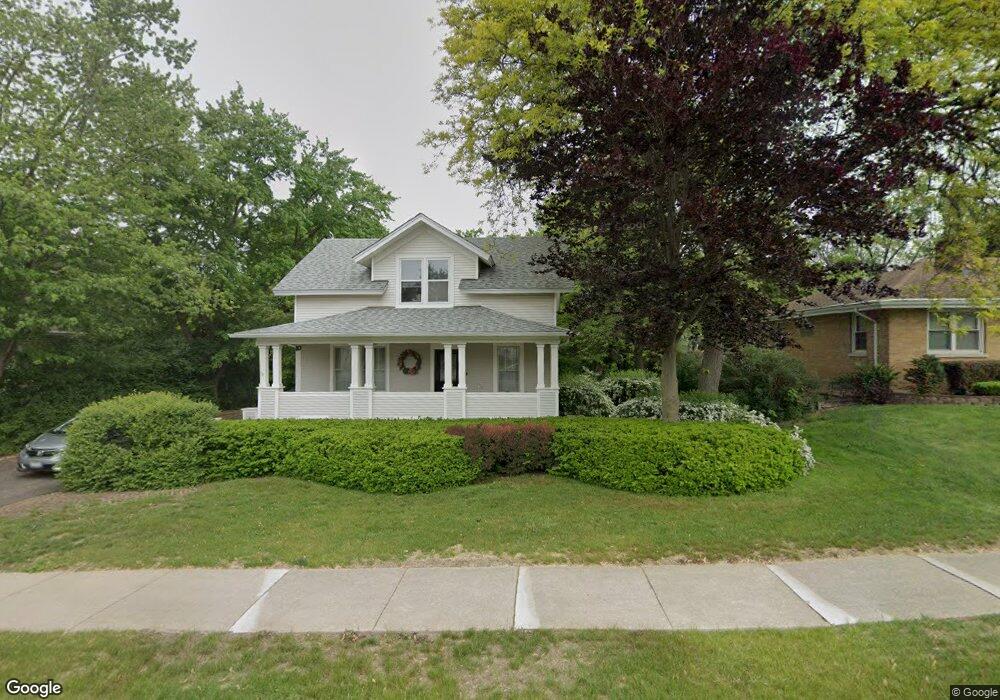
10 E Maple Ave Roselle, IL 60172
Estimated Value: $358,000 - $585,000
4
Beds
2
Baths
1,909
Sq Ft
$245/Sq Ft
Est. Value
About This Home
This home is located at 10 E Maple Ave, Roselle, IL 60172 and is currently estimated at $466,903, approximately $244 per square foot. 10 E Maple Ave is a home located in DuPage County with nearby schools including Spring Hills Elementary School, Roselle Middle School, and Lake Park High School.
Ownership History
Date
Name
Owned For
Owner Type
Purchase Details
Closed on
Sep 19, 2019
Sold by
Schramer Diane and Rasmussen Raymond M
Bought by
Rasmussen Raymond M and Rasmussen Diane M Koehler
Current Estimated Value
Purchase Details
Closed on
Aug 30, 2004
Sold by
Schramer H John and Schramer Diane
Bought by
Schramer Diane
Purchase Details
Closed on
Oct 30, 1997
Sold by
Lauritsen Richard S and Schaefer Lauritsen Wendy A
Bought by
Schramer H John and Schramer Diane M
Home Financials for this Owner
Home Financials are based on the most recent Mortgage that was taken out on this home.
Original Mortgage
$160,000
Outstanding Balance
$26,793
Interest Rate
7.51%
Estimated Equity
$440,110
Create a Home Valuation Report for This Property
The Home Valuation Report is an in-depth analysis detailing your home's value as well as a comparison with similar homes in the area
Home Values in the Area
Average Home Value in this Area
Purchase History
| Date | Buyer | Sale Price | Title Company |
|---|---|---|---|
| Rasmussen Raymond M | -- | Attorney | |
| Schramer Diane | -- | -- | |
| Schramer H John | $214,000 | -- |
Source: Public Records
Mortgage History
| Date | Status | Borrower | Loan Amount |
|---|---|---|---|
| Open | Schramer H John | $160,000 |
Source: Public Records
Tax History
| Year | Tax Paid | Tax Assessment Tax Assessment Total Assessment is a certain percentage of the fair market value that is determined by local assessors to be the total taxable value of land and additions on the property. | Land | Improvement |
|---|---|---|---|---|
| 2024 | $7,169 | $103,402 | $26,124 | $77,278 |
| 2023 | $6,620 | $94,560 | $23,890 | $70,670 |
| 2022 | $6,629 | $93,950 | $23,730 | $70,220 |
| 2021 | $6,341 | $89,270 | $22,550 | $66,720 |
| 2020 | $6,368 | $87,090 | $22,000 | $65,090 |
| 2019 | $6,183 | $83,690 | $21,140 | $62,550 |
| 2018 | $6,568 | $88,470 | $20,590 | $67,880 |
| 2017 | $6,302 | $82,000 | $19,080 | $62,920 |
| 2016 | $6,071 | $75,890 | $17,660 | $58,230 |
| 2015 | $5,476 | $70,820 | $16,480 | $54,340 |
| 2014 | $6,149 | $78,040 | $18,160 | $59,880 |
| 2013 | $6,095 | $80,710 | $18,780 | $61,930 |
Source: Public Records
Map
Nearby Homes
- 14 S Prospect St Unit 402
- 215 E Pine Ave
- 50 N Bokelman St Unit 234
- 100 N Bokelman St Unit 330
- 100 N Bokelman St Unit 329
- 207 Town Acres Ln
- 460 W Irving Park Rd
- 219 N Prospect St
- 160 Lincoln St
- 7N240 W End Rd
- 24W330 Central Ave
- 130 W End Rd
- 656 Rosner Dr Unit B
- 366 Ventura Club Dr
- 380 Ventura Club Dr
- 619 W End Rd
- 2235 Lake Shore Dr
- 2239 Lake Shore Dr
- 2237 Lake Shore Dr
- 2226 Lake Shore Dr
- 121 S Roselle Rd
- 20 E Maple Ave
- 23W651 Maple Ave
- 24 E Maple Ave
- 9 E Elm Ave
- 5 E Elm Ave
- 11 E Maple Ave
- 131 S Roselle Rd
- 15 E Elm Ave
- 17 E Maple Ave
- 23 E Elm Ave
- 114 S Roselle Rd
- 32 E Maple Ave
- 23 E Maple Ave
- 108 S Roselle Rd
- 120 S Roselle Rd
- 139 S Roselle Rd
- 31 E Elm Ave
- 33 E Maple Ave
- 102 S Roselle Rd
Your Personal Tour Guide
Ask me questions while you tour the home.