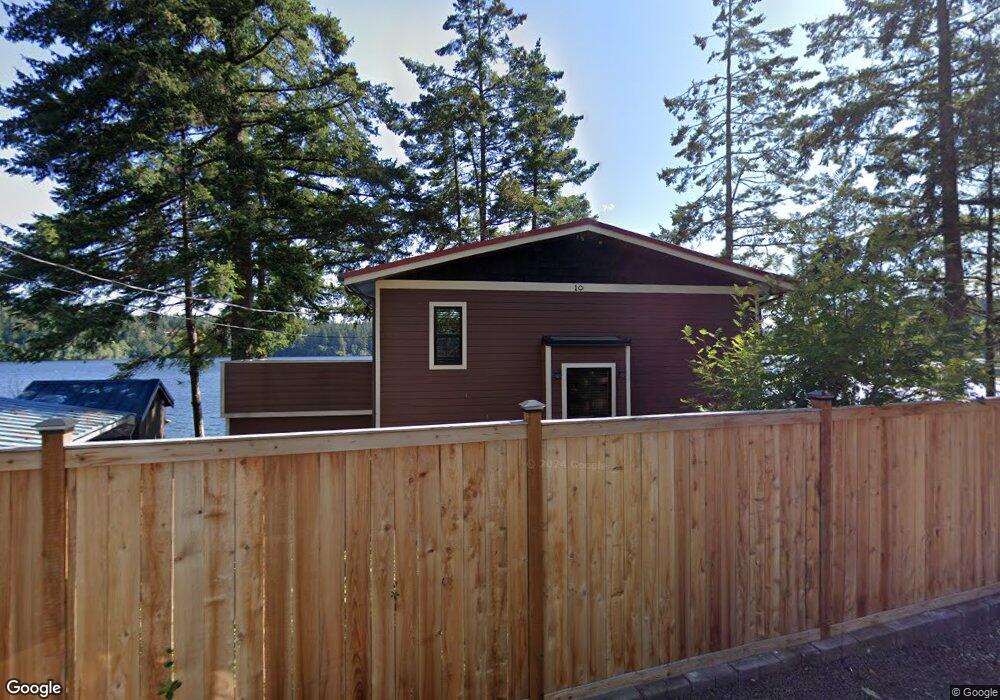
10 E Orchard Beach Dr Grapeview, WA 98546
Estimated Value: $436,000 - $572,000
2
Beds
2
Baths
840
Sq Ft
$614/Sq Ft
Est. Value
About This Home
This home is located at 10 E Orchard Beach Dr, Grapeview, WA 98546 and is currently estimated at $515,409, approximately $613 per square foot. 10 E Orchard Beach Dr is a home with nearby schools including Pioneer Primary School and Pioneer Intermediate/Middle School.
Ownership History
Date
Name
Owned For
Owner Type
Purchase Details
Closed on
Nov 26, 2024
Sold by
Hallman Lyle J
Bought by
Thompson Carolyn A
Current Estimated Value
Create a Home Valuation Report for This Property
The Home Valuation Report is an in-depth analysis detailing your home's value as well as a comparison with similar homes in the area
Purchase History
| Date | Buyer | Sale Price | Title Company |
|---|---|---|---|
| Thompson Carolyn A | -- | Land Title | |
| Thompson Carolyn A | -- | Land Title |
Source: Public Records
Tax History
| Year | Tax Paid | Tax Assessment Tax Assessment Total Assessment is a certain percentage of the fair market value that is determined by local assessors to be the total taxable value of land and additions on the property. | Land | Improvement |
|---|---|---|---|---|
| 2025 | $3,436 | $488,010 | $214,720 | $273,290 |
| 2023 | $3,436 | $388,040 | $181,230 | $206,810 |
| 2022 | $3,470 | $356,975 | $175,960 | $181,015 |
| 2021 | $3,349 | $356,975 | $175,960 | $181,015 |
| 2020 | $3,171 | $335,080 | $203,440 | $131,640 |
| 2018 | $2,897 | $268,615 | $181,645 | $86,970 |
| 2017 | $1,792 | $268,720 | $181,750 | $86,970 |
| 2016 | $1,744 | $174,305 | $89,855 | $84,450 |
| 2015 | $1,640 | $169,745 | $87,050 | $82,695 |
| 2014 | -- | $173,745 | $88,920 | $84,825 |
| 2013 | -- | $168,320 | $84,240 | $84,080 |
Source: Public Records
Map
Nearby Homes
- 81 E Panorama Way
- 4 E Cottonwood Dr
- 0 E Cottonwood Dr Unit 13 NWM2308746
- 0 E Cottonwood Dr Unit 40
- 0 E Cottonwood Dr Unit 40 NWM2308766
- 0 E Cottonwood Dr Unit 13 24324515
- 1236 E Island View Rd
- 1130 E Sunset Hill Rd
- 80 E Sea Breeze Ln
- 0 E Strong Rd Unit 34 24009692
- 0 E Strong Rd Unit 43 24316768
- 0 E Strong Rd Unit 34 NWM2308734
- 0 E Strong Rd Unit 43 NWM2308755
- 161 E Geist Point Dr
- 11 E Geist Point Rd
- 670 E Wilson Way
- 320 Rivendell Rd
- 930 E Wilson Way
- 900 930 E Wilson Way
- 900 E Wilson Way
- 0 E Orchard Beach Dr Unit 38574
- 0 E Orchard Beach Dr Unit 29126872
- 0 E Orchard Beach Dr Unit NWM30802539
- 0 E Orchard Beach Dr Unit 1862580
- 20 E Orchard Beach Dr
- 30 E Orchard Beach Dr
- 21 E Orchard Beach Dr
- 41 E Orchard Beach Dr
- 50 E Orchard Beach Dr
- 61 E Orchard Beach Dr
- 70 E Orchard Beach Dr
- 80 E Orchard Beach Dr
- 390 E Madrona Pkwy
- 420 E Madrona Pkwy
- 370 E Madrona Pkwy
- 430 E Madrona Pkwy
- 400 E Madrona Pkwy
- 101 E Orchard Beach Dr
- 360 E Madrona Pkwy
- 100 E Orchard Beach Dr
Your Personal Tour Guide
Ask me questions while you tour the home.