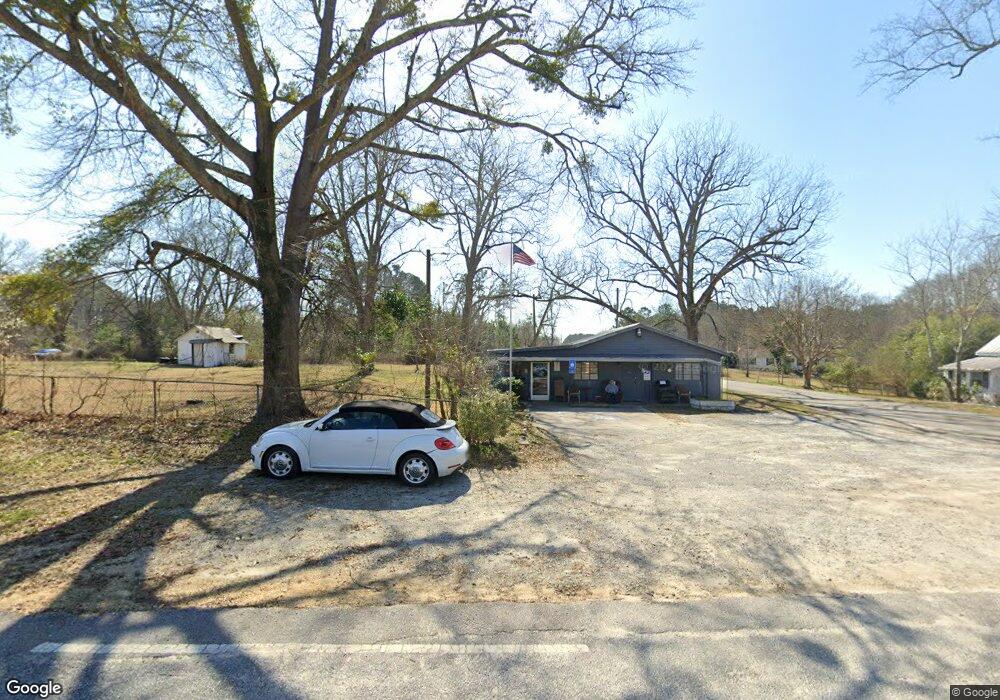
10 E Reese Rd Mesena, GA 30819
Estimated Value: $67,368 - $110,000
Studio
--
Bath
1,368
Sq Ft
$65/Sq Ft
Est. Value
About This Home
This home is located at 10 E Reese Rd, Mesena, GA 30819 and is currently estimated at $88,684, approximately $64 per square foot. 10 E Reese Rd is a home with nearby schools including Freeman Elementary School, Warren County Middle School, and Warren County High School.
Ownership History
Date
Name
Owned For
Owner Type
Purchase Details
Closed on
Feb 28, 2014
Sold by
Harden Marcus Gregory
Bought by
Harden Michael D
Current Estimated Value
Purchase Details
Closed on
Jan 24, 2014
Sold by
Harden William Gregory
Bought by
Harden Marcus Gregory and Harden Mary Anna
Purchase Details
Closed on
May 26, 2011
Sold by
Johnson Alan B
Bought by
Harden William Gregory
Purchase Details
Closed on
Feb 16, 2007
Sold by
Spires Claude E
Bought by
Johnson Alan B and Johnson Harden Gregory
Purchase Details
Closed on
Feb 6, 2002
Sold by
Friar Frankie N Etal
Bought by
Spires Claude E
Purchase Details
Closed on
Sep 15, 1992
Bought by
Friar Frankie N Etal
Create a Home Valuation Report for This Property
The Home Valuation Report is an in-depth analysis detailing your home's value as well as a comparison with similar homes in the area
Purchase History
| Date | Buyer | Sale Price | Title Company |
|---|---|---|---|
| Harden Michael D | -- | -- | |
| Harden Marcus Gregory | -- | -- | |
| Harden William Gregory | $15,000 | -- | |
| Johnson Alan B | $45,000 | -- | |
| Spires Claude E | $55,000 | -- | |
| Friar Frankie N Etal | -- | -- |
Source: Public Records
Tax History
| Year | Tax Paid | Tax Assessment Tax Assessment Total Assessment is a certain percentage of the fair market value that is determined by local assessors to be the total taxable value of land and additions on the property. | Land | Improvement |
|---|---|---|---|---|
| 2025 | $86 | $6,290 | $3,250 | $3,040 |
| 2024 | $88 | $4,846 | $1,806 | $3,040 |
| 2023 | $88 | $4,846 | $1,806 | $3,040 |
| 2022 | $88 | $4,846 | $1,806 | $3,040 |
| 2021 | $88 | $4,846 | $1,806 | $3,040 |
| 2020 | $89 | $4,846 | $1,806 | $3,040 |
| 2019 | $89 | $4,846 | $1,806 | $3,040 |
| 2018 | $147 | $4,846 | $1,806 | $3,040 |
| 2017 | $86 | $4,846 | $1,806 | $3,040 |
| 2016 | $157 | $4,846 | $1,806 | $3,040 |
| 2015 | -- | $4,846 | $1,806 | $3,040 |
| 2014 | -- | $5,140 | $2,100 | $3,040 |
| 2013 | -- | $5,140 | $2,100 | $3,040 |
Source: Public Records
Map
Nearby Homes
- 5636 Georgia 80
- 151 Gin Branch Rd
- 141 Gin Branch Rd
- 110 Gin Branch Rd
- 125 Gin Branch Rd
- 150 Gin Branch Rd
- 140 Gin Branch Rd
- 124 Gin Branch Rd
- 125 Big Rock Rd
- 126 Big Rock Rd
- 110 Big Rock Rd
- 141 Big Rock Rd
- 140 Big Rock Rd
- 150 Big Rock Rd
- 111 Alcovy Rd
- 156 Alcovy Rd
- 167 Alcovy Rd
- 125 Alcovy Rd
- 126 Alcovy Rd
- 141 Alcovy Rd
- 7 W Reese Rd
- 24 E Reese Rd
- 2627 Mesena Rd
- 1666 Mesena Rd
- 2727 Mesena Rd
- 2727 Mesena Rd
- 2573 Mesena Rd
- 2747 Mesena Rd
- 120 E Reese Rd
- 2773 Mesena Rd
- 669 Stone Chapel Rd
- 662 Stone Chapel Rd
- 3053 Stone Chapel Rd
- 188 E Reese Rd
- 634 Stone Chapel Rd
- 2455 Mesena Rd
- 1043 Union Church Rd
- 611 Stone Chapel Rd
- 599 Stone Chapel Rd
- 606 Stone Chapel Rd
Your Personal Tour Guide
Ask me questions while you tour the home.