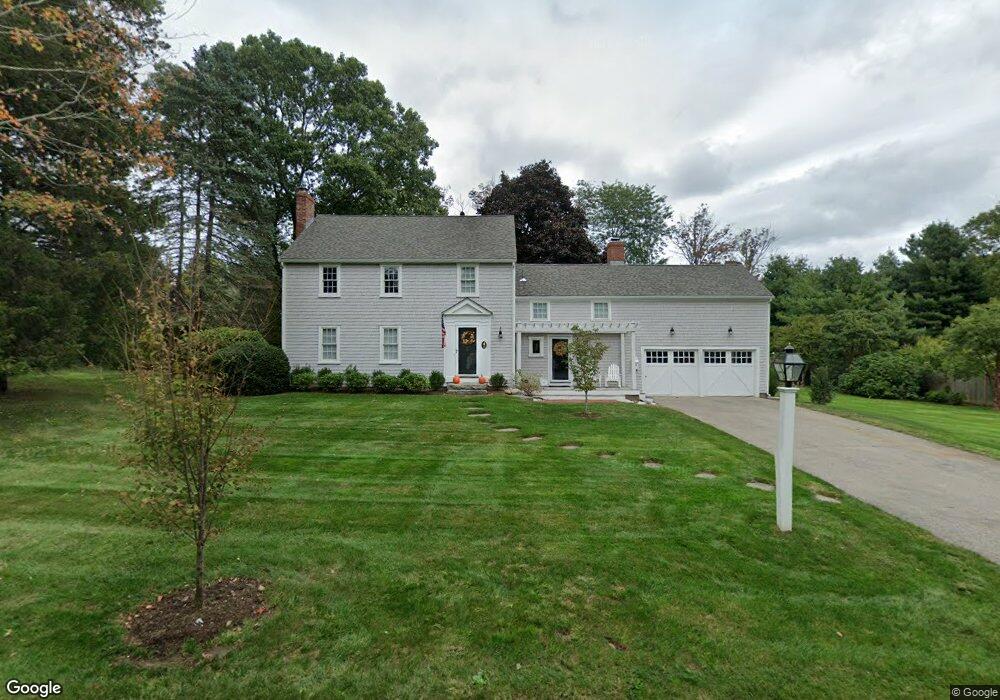
10 Eastgate Ln Hingham, MA 02043
Estimated Value: $1,580,000 - $1,856,000
4
Beds
3
Baths
2,242
Sq Ft
$793/Sq Ft
Est. Value
About This Home
This home is located at 10 Eastgate Ln, Hingham, MA 02043 and is currently estimated at $1,777,555, approximately $792 per square foot. 10 Eastgate Ln is a home located in Plymouth County with nearby schools including East Elementary School, Hingham Middle School, and Hingham High School.
Ownership History
Date
Name
Owned For
Owner Type
Purchase Details
Closed on
Oct 28, 2016
Sold by
Doherty Timothy P and Doherty Susan S
Bought by
Mccullough John and Mccullqugh Andrea
Current Estimated Value
Home Financials for this Owner
Home Financials are based on the most recent Mortgage that was taken out on this home.
Original Mortgage
$880,000
Outstanding Balance
$708,264
Interest Rate
3.5%
Mortgage Type
Unknown
Estimated Equity
$1,069,291
Purchase Details
Closed on
Dec 24, 2002
Sold by
Atwood J Brian and Atwood Susan J
Bought by
Doherty Timothy P and Doherty Susan S
Purchase Details
Closed on
Sep 3, 1999
Sold by
Brown D Mitchell and Brown Angela M
Bought by
Atwood J Brian and Atwood Susan J
Purchase Details
Closed on
Jul 28, 1992
Sold by
Clayton John G and Clayton Marcia W
Bought by
Brown Mitchell O and Brown Angela M
Create a Home Valuation Report for This Property
The Home Valuation Report is an in-depth analysis detailing your home's value as well as a comparison with similar homes in the area
Purchase History
| Date | Buyer | Sale Price | Title Company |
|---|---|---|---|
| Mccullough John | $1,100,000 | -- | |
| Doherty Timothy P | $740,000 | -- | |
| Atwood J Brian | $565,000 | -- | |
| Brown Mitchell O | $315,000 | -- |
Source: Public Records
Mortgage History
| Date | Status | Borrower | Loan Amount |
|---|---|---|---|
| Open | Mccullough John | $880,000 | |
| Previous Owner | Brown Mitchell O | $366,500 | |
| Previous Owner | Brown Mitchell O | $75,000 |
Source: Public Records
Tax History
| Year | Tax Paid | Tax Assessment Tax Assessment Total Assessment is a certain percentage of the fair market value that is determined by local assessors to be the total taxable value of land and additions on the property. | Land | Improvement |
|---|---|---|---|---|
| 2025 | $15,693 | $1,468,000 | $738,900 | $729,100 |
| 2024 | $14,710 | $1,355,800 | $738,900 | $616,900 |
| 2023 | $13,010 | $1,301,000 | $738,900 | $562,100 |
| 2022 | $12,587 | $1,088,800 | $636,800 | $452,000 |
| 2021 | $12,504 | $1,059,700 | $636,800 | $422,900 |
| 2020 | $10,995 | $953,600 | $530,700 | $422,900 |
| 2019 | $10,949 | $927,100 | $530,700 | $396,400 |
| 2018 | $10,912 | $927,100 | $530,700 | $396,400 |
| 2017 | $10,065 | $821,600 | $530,700 | $290,900 |
| 2016 | $9,943 | $796,100 | $505,200 | $290,900 |
| 2015 | $9,653 | $770,400 | $480,600 | $289,800 |
Source: Public Records
Map
Nearby Homes
Your Personal Tour Guide
Ask me questions while you tour the home.