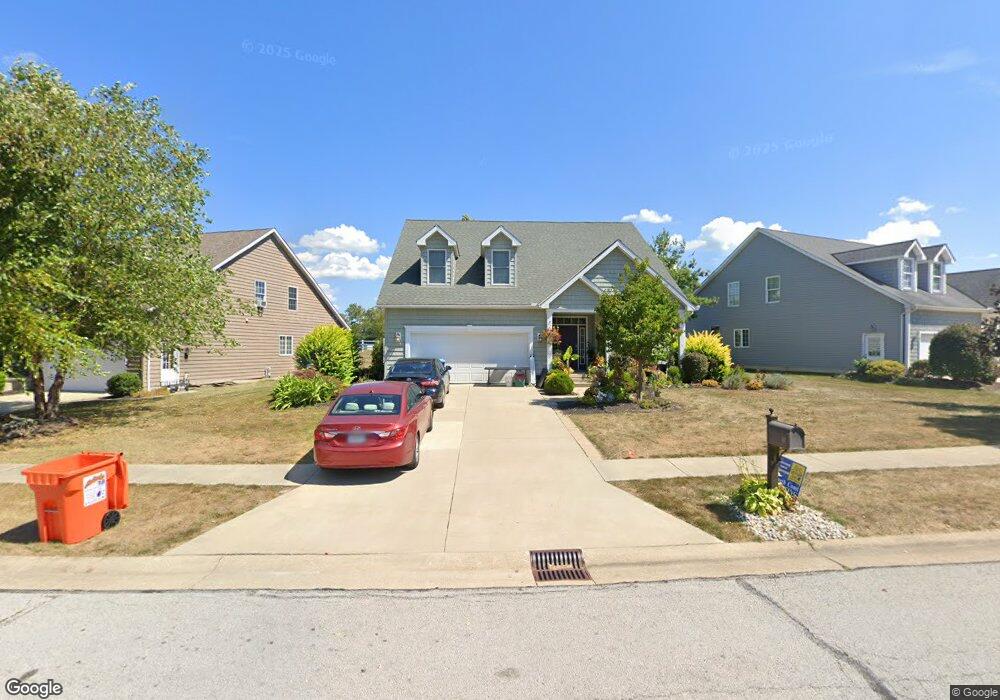
10 Edgewater Ct Unit 299 Wakeman, OH 44889
Estimated Value: $264,000 - $372,726
3
Beds
1
Bath
2,642
Sq Ft
$123/Sq Ft
Est. Value
About This Home
This home is located at 10 Edgewater Ct Unit 299, Wakeman, OH 44889 and is currently estimated at $325,432, approximately $123 per square foot. 10 Edgewater Ct Unit 299 is a home located in Huron County with nearby schools including Western Reserve Elementary School, Western Reserve Middle School, and Western Reserve High School.
Ownership History
Date
Name
Owned For
Owner Type
Purchase Details
Closed on
Mar 18, 2020
Sold by
Landmax Limited
Bought by
Rosemark Nicolas and Rosemark Jennifer
Current Estimated Value
Home Financials for this Owner
Home Financials are based on the most recent Mortgage that was taken out on this home.
Original Mortgage
$214,500
Interest Rate
3.2%
Mortgage Type
New Conventional
Purchase Details
Closed on
Mar 10, 2020
Bought by
Landmax Liited An Ohio Liability Co
Home Financials for this Owner
Home Financials are based on the most recent Mortgage that was taken out on this home.
Original Mortgage
$214,500
Interest Rate
3.2%
Mortgage Type
New Conventional
Purchase Details
Closed on
Nov 28, 2007
Bought by
Landmax Limited An Ohio Liability Compan
Create a Home Valuation Report for This Property
The Home Valuation Report is an in-depth analysis detailing your home's value as well as a comparison with similar homes in the area
Purchase History
| Date | Buyer | Sale Price | Title Company |
|---|---|---|---|
| Rosemark Nicolas | $228,000 | None Available | |
| Landmax Liited An Ohio Liability Co | -- | -- | |
| Landmax Limited An Ohio Liability Compan | -- | -- |
Source: Public Records
Mortgage History
| Date | Status | Borrower | Loan Amount |
|---|---|---|---|
| Previous Owner | Rosemark Nicolas | $214,500 |
Source: Public Records
Tax History
| Year | Tax Paid | Tax Assessment Tax Assessment Total Assessment is a certain percentage of the fair market value that is determined by local assessors to be the total taxable value of land and additions on the property. | Land | Improvement |
|---|---|---|---|---|
| 2024 | $4,251 | $111,330 | $7,530 | $103,800 |
| 2023 | $4,236 | $89,350 | $7,440 | $81,910 |
| 2022 | $3,406 | $89,350 | $7,440 | $81,910 |
| 2021 | $3,506 | $89,350 | $7,440 | $81,910 |
| 2020 | $3,428 | $81,010 | $7,440 | $73,570 |
| 2019 | $6,614 | $156,860 | $14,880 | $141,980 |
| 2018 | $6,552 | $156,860 | $14,880 | $141,980 |
| 2017 | $6,062 | $146,460 | $14,880 | $131,580 |
| 2016 | $4,874 | $119,670 | $14,880 | $104,790 |
| 2015 | $4,170 | $119,680 | $14,880 | $104,800 |
| 2014 | $2,536 | $63,040 | $11,170 | $51,870 |
| 2013 | $1,345 | $63,040 | $11,170 | $51,870 |
Source: Public Records
Map
Nearby Homes
- 22 E Main St
- 38 Pleasant St
- 5 Foxwood Cir
- 34 Cherdon Cir
- 27 Deer Run Dr
- 22 Foxwood Cir
- 6175 U S 20
- 258 Stony Brook Ln
- 0 Stony Brook Ln
- 284 Stony Brook Ln
- 283 Stony Brook Ln
- V/L 260 Stony Brook Ln
- V/L 284 Stony Brook Ln
- V/L 283 Stony Brook Ln
- 42 Stony Brook Ln
- 29 Stony Brook Ln
- V/L 258 Stony Brook Ln
- 4883 W River Rd
- 5951 Ohio 303
- 14178 West Rd
- 10 Edgewater Ct
- 10 SL Edgewater Ct
- 12 Edgewater Ct Unit 301
- 12 Edgewater Ct
- 12 SL Edgewater Ct
- 1 Edgewater Ct
- 8 Edgewater Ct Unit 297
- 8 Edgewater Ct
- 8 SL Edgewater Ct
- 9 Edgewater Ct
- 13 SL Edgewater Ct
- 14 SL Edgewater Ct
- 14 Edgewater Ct Unit 303
- 14 Edgewater Ct
- 7 SL Edgewater Ct
- 7 Edgewater Ct Unit 296
- 7 Edgewater Ct
- 11 Edgewater Ct Unit 300
- 11 Edgewater Ct
- 9 Edgewater Ct Unit 298
Your Personal Tour Guide
Ask me questions while you tour the home.