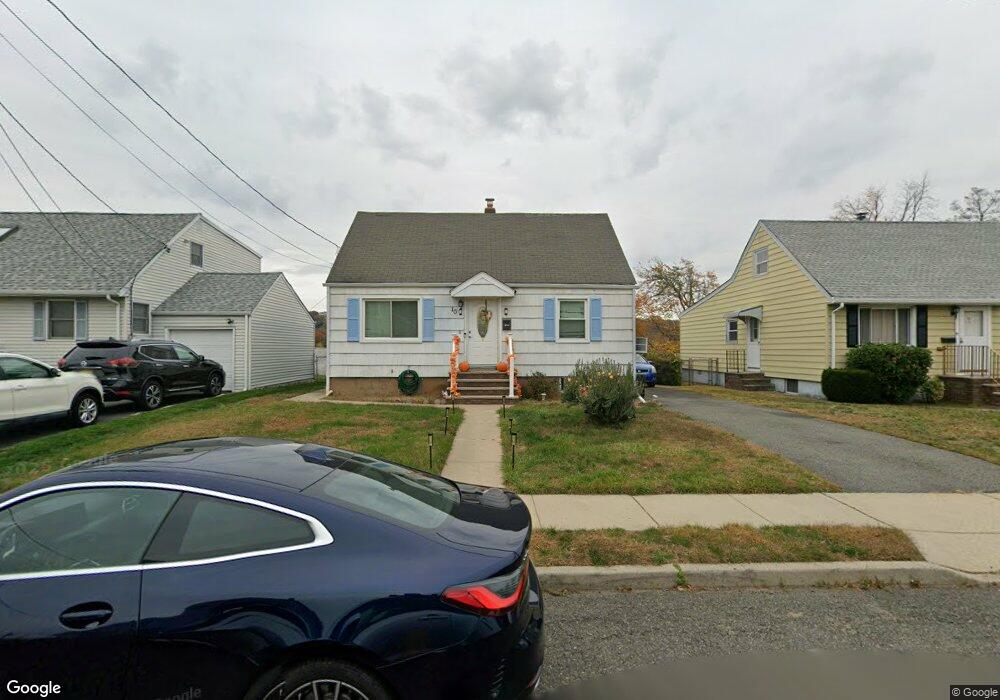
10 Edward Ct Clifton, NJ 07011
Hazel NeighborhoodEstimated Value: $524,301 - $560,000
3
Beds
1
Bath
1,229
Sq Ft
$446/Sq Ft
Est. Value
About This Home
This home is located at 10 Edward Ct, Clifton, NJ 07011 and is currently estimated at $547,825, approximately $445 per square foot. 10 Edward Ct is a home located in Passaic County with nearby schools including Clifton High School, Paterson Charter School for Science & Technology, and Njedda Elementary School.
Ownership History
Date
Name
Owned For
Owner Type
Purchase Details
Closed on
Jun 14, 2019
Sold by
Langston Elizabeth A and Langston Elizabeth Ann
Bought by
Rodriguez Lupe A and Sedano Alexander
Current Estimated Value
Home Financials for this Owner
Home Financials are based on the most recent Mortgage that was taken out on this home.
Original Mortgage
$289,656
Outstanding Balance
$257,278
Interest Rate
4.62%
Mortgage Type
FHA
Estimated Equity
$290,547
Purchase Details
Closed on
May 12, 1988
Bought by
Kamphausen John T
Create a Home Valuation Report for This Property
The Home Valuation Report is an in-depth analysis detailing your home's value as well as a comparison with similar homes in the area
Home Values in the Area
Average Home Value in this Area
Purchase History
| Date | Buyer | Sale Price | Title Company |
|---|---|---|---|
| Rodriguez Lupe A | $295,000 | Sunnyside Title Agency Llc | |
| Kamphausen John T | -- | -- |
Source: Public Records
Mortgage History
| Date | Status | Borrower | Loan Amount |
|---|---|---|---|
| Open | Rodriguez Lupe A | $289,656 |
Source: Public Records
Tax History Compared to Growth
Tax History
| Year | Tax Paid | Tax Assessment Tax Assessment Total Assessment is a certain percentage of the fair market value that is determined by local assessors to be the total taxable value of land and additions on the property. | Land | Improvement |
|---|---|---|---|---|
| 2025 | $8,673 | $146,100 | $90,000 | $56,100 |
| 2024 | $8,465 | $146,100 | $90,000 | $56,100 |
| 2022 | $8,342 | $146,100 | $90,000 | $56,100 |
| 2021 | $7,999 | $146,100 | $90,000 | $56,100 |
| 2020 | $8,025 | $146,100 | $90,000 | $56,100 |
| 2019 | $7,968 | $146,100 | $90,000 | $56,100 |
| 2018 | $7,923 | $146,100 | $90,000 | $56,100 |
| 2017 | $7,837 | $146,100 | $90,000 | $56,100 |
| 2016 | $7,685 | $146,100 | $90,000 | $56,100 |
| 2015 | $7,610 | $146,100 | $90,000 | $56,100 |
| 2014 | $7,454 | $146,100 | $90,000 | $56,100 |
Source: Public Records
Map
Nearby Homes