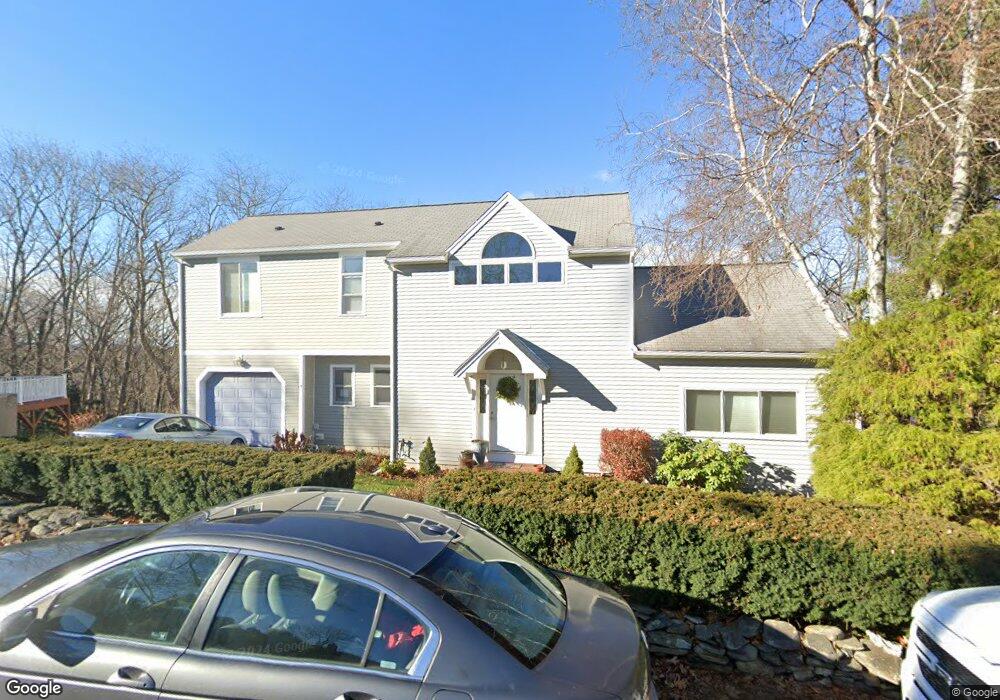
10 Edward Dr Winchester, MA 01890
West Side NeighborhoodEstimated Value: $1,637,707 - $1,808,000
3
Beds
4
Baths
3,497
Sq Ft
$495/Sq Ft
Est. Value
About This Home
This home is located at 10 Edward Dr, Winchester, MA 01890 and is currently estimated at $1,730,677, approximately $494 per square foot. 10 Edward Dr is a home located in Middlesex County with nearby schools including Vinson-Owen Elementary School, McCall Middle School, and Winchester High School.
Ownership History
Date
Name
Owned For
Owner Type
Purchase Details
Closed on
Jan 3, 1997
Sold by
Martz David B and Martz Sophia K
Bought by
Spies Brian R and Spies Anne B
Current Estimated Value
Home Financials for this Owner
Home Financials are based on the most recent Mortgage that was taken out on this home.
Original Mortgage
$32,880
Interest Rate
7.48%
Mortgage Type
Purchase Money Mortgage
Purchase Details
Closed on
Apr 15, 1993
Sold by
Hovspeian Edward A and Hovspeian April M
Bought by
Martz David B and Martz Sophia K
Home Financials for this Owner
Home Financials are based on the most recent Mortgage that was taken out on this home.
Original Mortgage
$200,000
Interest Rate
7.39%
Mortgage Type
Purchase Money Mortgage
Create a Home Valuation Report for This Property
The Home Valuation Report is an in-depth analysis detailing your home's value as well as a comparison with similar homes in the area
Home Values in the Area
Average Home Value in this Area
Purchase History
| Date | Buyer | Sale Price | Title Company |
|---|---|---|---|
| Spies Brian R | $411,000 | -- | |
| Martz David B | $360,000 | -- |
Source: Public Records
Mortgage History
| Date | Status | Borrower | Loan Amount |
|---|---|---|---|
| Open | Martz David B | $275,000 | |
| Closed | Martz David B | $32,880 | |
| Previous Owner | Martz David B | $200,000 | |
| Previous Owner | Martz David B | $292,000 |
Source: Public Records
Tax History Compared to Growth
Tax History
| Year | Tax Paid | Tax Assessment Tax Assessment Total Assessment is a certain percentage of the fair market value that is determined by local assessors to be the total taxable value of land and additions on the property. | Land | Improvement |
|---|---|---|---|---|
| 2025 | $147 | $1,322,900 | $558,700 | $764,200 |
| 2024 | $14,421 | $1,272,800 | $558,700 | $714,100 |
| 2023 | $14,140 | $1,198,300 | $512,200 | $686,100 |
| 2022 | $12,531 | $1,001,700 | $388,000 | $613,700 |
| 2021 | $7,057 | $976,900 | $380,200 | $596,700 |
| 2020 | $12,104 | $976,900 | $380,200 | $596,700 |
| 2019 | $11,079 | $914,900 | $318,200 | $596,700 |
| 2018 | $10,772 | $883,700 | $302,600 | $581,100 |
| 2017 | $6,004 | $845,300 | $287,100 | $558,200 |
| 2016 | $9,689 | $829,500 | $287,100 | $542,400 |
| 2015 | $9,510 | $783,400 | $260,000 | $523,400 |
| 2014 | $9,418 | $743,900 | $225,000 | $518,900 |
Source: Public Records
Map
Nearby Homes