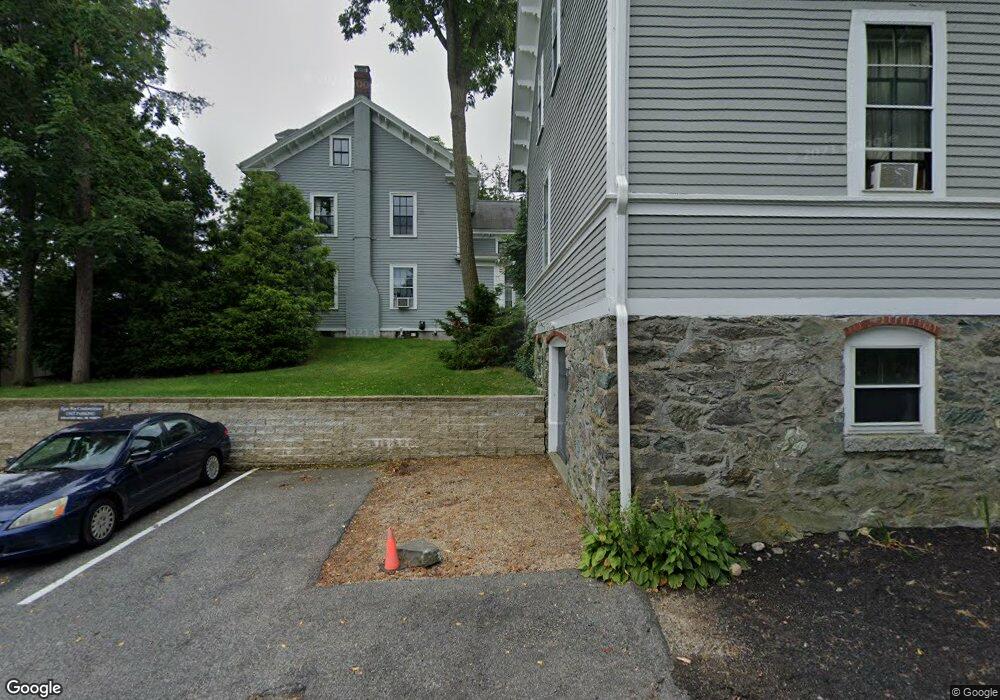
10 Egan Way Unit 1 Brighton, MA 02135
Brighton NeighborhoodEstimated Value: $396,000 - $423,000
1
Bed
1
Bath
580
Sq Ft
$701/Sq Ft
Est. Value
About This Home
This home is located at 10 Egan Way Unit 1, Brighton, MA 02135 and is currently estimated at $406,562, approximately $700 per square foot. 10 Egan Way Unit 1 is a home located in Suffolk County with nearby schools including Shaloh House Jewish Day School, St Columbkille Partnership School, and Mesivta High School of Greater Boston.
Ownership History
Date
Name
Owned For
Owner Type
Purchase Details
Closed on
May 29, 1996
Sold by
Rosenthal William J
Bought by
Carter Sarah H
Current Estimated Value
Purchase Details
Closed on
Feb 1, 1994
Sold by
Jaroch Diane V
Bought by
Rosenthal William J
Home Financials for this Owner
Home Financials are based on the most recent Mortgage that was taken out on this home.
Original Mortgage
$75,400
Interest Rate
7.11%
Mortgage Type
Purchase Money Mortgage
Purchase Details
Closed on
Oct 6, 1992
Sold by
Maverick Rlty Inc
Bought by
Fitzgerald Dorothy
Home Financials for this Owner
Home Financials are based on the most recent Mortgage that was taken out on this home.
Original Mortgage
$60,000
Interest Rate
7.83%
Mortgage Type
Purchase Money Mortgage
Create a Home Valuation Report for This Property
The Home Valuation Report is an in-depth analysis detailing your home's value as well as a comparison with similar homes in the area
Home Values in the Area
Average Home Value in this Area
Purchase History
| Date | Buyer | Sale Price | Title Company |
|---|---|---|---|
| Carter Sarah H | $84,000 | -- | |
| Carter Sarah H | $84,000 | -- | |
| Rosenthal William J | $79,400 | -- | |
| Rosenthal William J | $79,400 | -- | |
| Fitzgerald Dorothy | $75,000 | -- | |
| Fitzgerald Dorothy | $75,000 | -- | |
| Fitzgerald Dorothy | $75,000 | -- |
Source: Public Records
Mortgage History
| Date | Status | Borrower | Loan Amount |
|---|---|---|---|
| Open | Fitzgerald Dorothy | $96,900 | |
| Previous Owner | Rosenthal William J | $75,400 | |
| Previous Owner | Fitzgerald Dorothy | $60,000 |
Source: Public Records
Tax History
| Year | Tax Paid | Tax Assessment Tax Assessment Total Assessment is a certain percentage of the fair market value that is determined by local assessors to be the total taxable value of land and additions on the property. | Land | Improvement |
|---|---|---|---|---|
| 2025 | $4,121 | $355,900 | $0 | $355,900 |
| 2024 | $3,972 | $364,400 | $0 | $364,400 |
| 2023 | $3,914 | $364,400 | $0 | $364,400 |
| 2022 | $3,775 | $347,000 | $0 | $347,000 |
| 2021 | $3,630 | $340,200 | $0 | $340,200 |
| 2020 | $3,175 | $300,700 | $0 | $300,700 |
| 2019 | $2,748 | $260,700 | $0 | $260,700 |
| 2018 | $2,614 | $249,400 | $0 | $249,400 |
| 2017 | $2,446 | $231,000 | $0 | $231,000 |
| 2016 | $2,420 | $220,000 | $0 | $220,000 |
| 2015 | $2,432 | $200,800 | $0 | $200,800 |
| 2014 | $2,295 | $182,400 | $0 | $182,400 |
Source: Public Records
Map
Nearby Homes
- 461 Washington St Unit 301
- 83-85 Surrey St
- 65-67 Surrey St
- 115 Bennett St Unit 1
- 47 Dighton St
- 47-49 Dighton St
- 30 Leicester St
- 30 Dighton St Unit 1
- 30 Dighton St Unit 4
- 14 Bothwell Rd
- 6-8 Cenacle Rd
- 12 Mina Way
- 41-43 Arlington St
- 571-575 Washington St
- 15-17 Donnybrook Rd
- 29-31 Hobson St
- 354 Market St Unit 9
- 21 Upcrest Rd
- 69 Chestnut Hill Ave
- 27 Shepard St Unit 3
- 10 Egan Way Unit 5
- 10 Egan Way Unit 3
- 10 Egan Way Unit 4
- 10 Egan Way Unit 2
- 10 Egan Way Unit 4,1
- 10 Egan Way Unit 4, 10
- 17 Malbert Rd Unit 3
- 17 Malbert Rd Unit 2
- 17 Malbert Rd Unit 1
- 15 Malbert Rd
- 15 Malbert Rd
- 15 Malbert Rd Unit 1
- 20 Oakland St
- 16 Oakland St
- 4 Egan Way
- 11 Malbert Rd
- 11 Malbert Rd Unit 2
- 16 Malbert Rd Unit 2
- 18 Malbert Rd Unit 2
- 16 Malbert Rd Unit 6-bed 2-bath
Your Personal Tour Guide
Ask me questions while you tour the home.