Estimated Value: $1,932,000 - $2,105,067
4
Beds
5
Baths
2,589
Sq Ft
$789/Sq Ft
Est. Value
About This Home
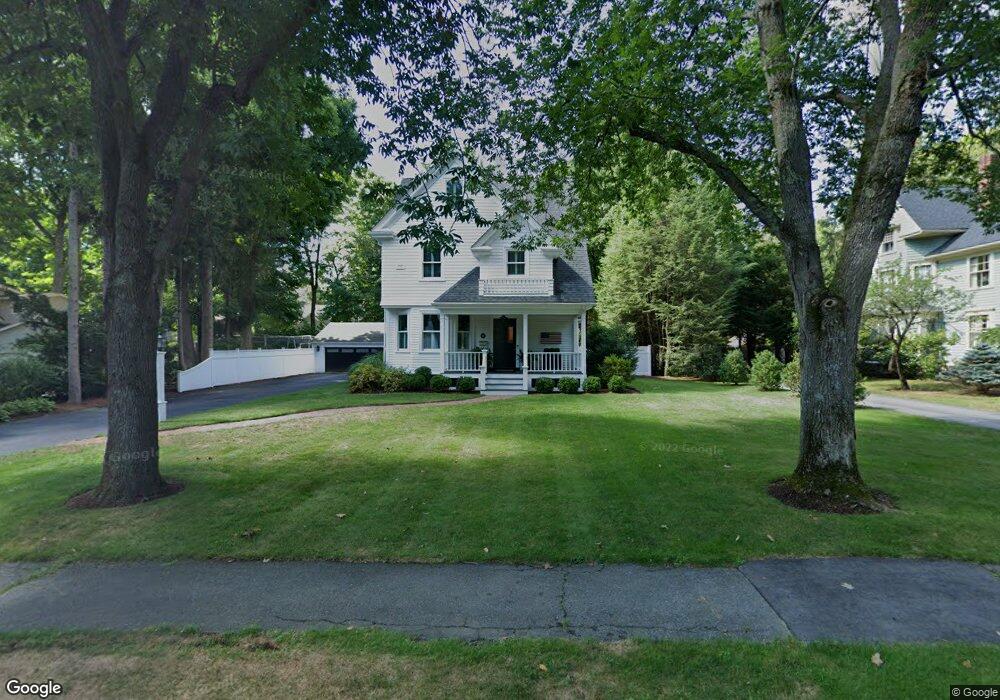
This home is located at 10 Elm St, Wellesley Hills, MA 02481 and is currently estimated at $2,042,517, approximately $788 per square foot. 10 Elm St is a home located in Norfolk County with nearby schools including Schofield Elementary School, Wellesley Middle School, and Wellesley Sr High School.
Ownership History
Date
Name
Owned For
Owner Type
Purchase Details
Closed on
Oct 20, 1997
Sold by
Campbell Joseph S and Campbell Theresa B
Bought by
Bosland James L and Bosland Julai H
Current Estimated Value
Purchase Details
Closed on
Sep 27, 1996
Sold by
Gillis Arthur L and Gillis Caredith
Bought by
Campbell Joseph S and Campbell Theresa B
Create a Home Valuation Report for This Property
The Home Valuation Report is an in-depth analysis detailing your home's value as well as a comparison with similar homes in the area
Home Values in the Area
Average Home Value in this Area
Purchase History
| Date | Buyer | Sale Price | Title Company |
|---|---|---|---|
| Bosland James L | $730,000 | -- | |
| Campbell Joseph S | $640,000 | -- |
Source: Public Records
Mortgage History
| Date | Status | Borrower | Loan Amount |
|---|---|---|---|
| Open | Campbell Joseph S | $500,000 | |
| Closed | Campbell Joseph S | $380,000 |
Source: Public Records
Tax History Compared to Growth
Tax History
| Year | Tax Paid | Tax Assessment Tax Assessment Total Assessment is a certain percentage of the fair market value that is determined by local assessors to be the total taxable value of land and additions on the property. | Land | Improvement |
|---|---|---|---|---|
| 2025 | $16,510 | $1,606,000 | $1,063,000 | $543,000 |
| 2024 | $15,396 | $1,479,000 | $962,000 | $517,000 |
| 2023 | $15,240 | $1,331,000 | $860,000 | $471,000 |
| 2022 | $14,483 | $1,240,000 | $770,000 | $470,000 |
| 2021 | $13,783 | $1,173,000 | $703,000 | $470,000 |
| 2020 | $13,560 | $1,173,000 | $703,000 | $470,000 |
| 2019 | $13,572 | $1,173,000 | $703,000 | $470,000 |
| 2018 | $14,029 | $1,174,000 | $740,000 | $434,000 |
| 2017 | $13,830 | $1,173,000 | $739,000 | $434,000 |
| 2016 | $13,522 | $1,143,000 | $727,000 | $416,000 |
| 2015 | $13,213 | $1,143,000 | $727,000 | $416,000 |
Source: Public Records
Map
Nearby Homes