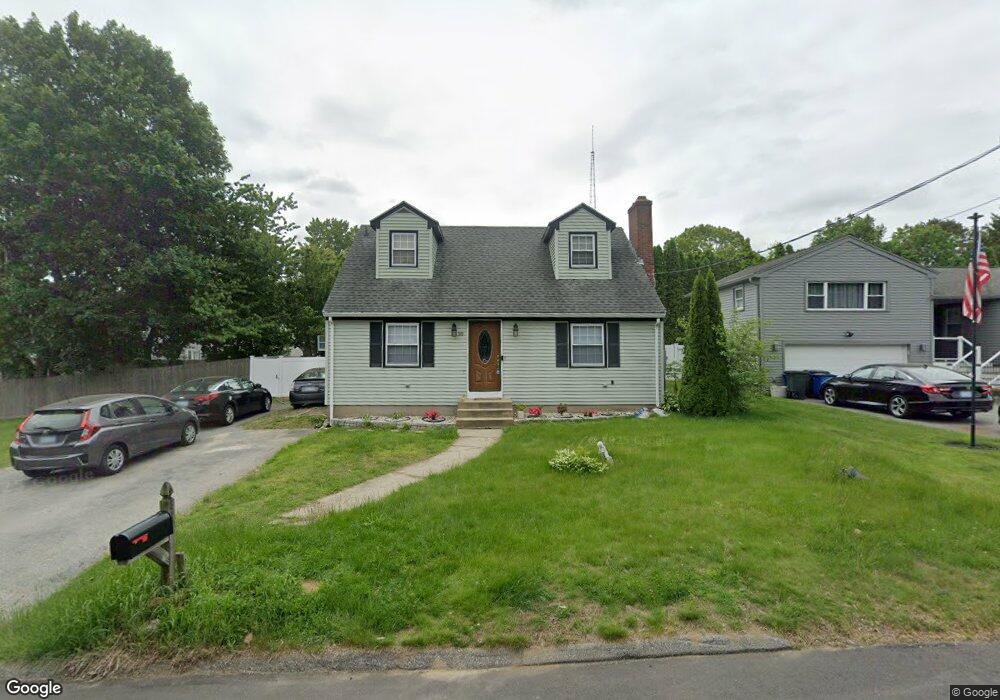
10 Enfield St Johnston, RI 02919
Thornton NeighborhoodEstimated Value: $393,000 - $446,000
4
Beds
2
Baths
1,613
Sq Ft
$257/Sq Ft
Est. Value
About This Home
This home is located at 10 Enfield St, Johnston, RI 02919 and is currently estimated at $414,665, approximately $257 per square foot. 10 Enfield St is a home located in Providence County with nearby schools including Johnston Senior High School and Achievement First Promesa.
Ownership History
Date
Name
Owned For
Owner Type
Purchase Details
Closed on
Dec 10, 2021
Sold by
Chan Tinna L and Mau Heng N
Bought by
Mau Tinno
Current Estimated Value
Purchase Details
Closed on
Apr 25, 2011
Sold by
Ferri George V
Bought by
Fhlmc
Purchase Details
Closed on
Feb 22, 2007
Sold by
Checko Michael F and Checko Michelle
Bought by
Ferri George V
Home Financials for this Owner
Home Financials are based on the most recent Mortgage that was taken out on this home.
Original Mortgage
$250,000
Interest Rate
6.23%
Mortgage Type
Purchase Money Mortgage
Purchase Details
Closed on
Aug 29, 2002
Sold by
Dicenzo Jean F Ret
Bought by
Checko Michael F and Checko Michelle
Create a Home Valuation Report for This Property
The Home Valuation Report is an in-depth analysis detailing your home's value as well as a comparison with similar homes in the area
Home Values in the Area
Average Home Value in this Area
Purchase History
| Date | Buyer | Sale Price | Title Company |
|---|---|---|---|
| Mau Tinno | $260,000 | None Available | |
| Mau Tinno | $260,000 | None Available | |
| Fhlmc | $293,448 | -- | |
| Ferri George V | $250,000 | -- | |
| Checko Michael F | $184,500 | -- | |
| Fhlmc | $293,448 | -- | |
| Ferri George V | $250,000 | -- | |
| Checko Michael F | $184,500 | -- |
Source: Public Records
Mortgage History
| Date | Status | Borrower | Loan Amount |
|---|---|---|---|
| Previous Owner | Checko Michael F | $250,000 | |
| Previous Owner | Checko Michael F | $188,000 |
Source: Public Records
Tax History Compared to Growth
Tax History
| Year | Tax Paid | Tax Assessment Tax Assessment Total Assessment is a certain percentage of the fair market value that is determined by local assessors to be the total taxable value of land and additions on the property. | Land | Improvement |
|---|---|---|---|---|
| 2025 | $5,214 | $333,800 | $85,500 | $248,300 |
| 2024 | $5,107 | $333,800 | $85,500 | $248,300 |
| 2023 | $5,107 | $333,800 | $85,500 | $248,300 |
| 2022 | $8,747 | $216,700 | $65,700 | $151,000 |
| 2021 | $5,036 | $216,700 | $65,700 | $151,000 |
| 2018 | $5,108 | $185,800 | $51,600 | $134,200 |
| 2016 | $6,758 | $185,800 | $51,600 | $134,200 |
| 2015 | $4,850 | $167,300 | $54,000 | $113,300 |
| 2014 | $3,848 | $167,300 | $54,000 | $113,300 |
| 2013 | $4,810 | $167,300 | $54,000 | $113,300 |
Source: Public Records
Map
Nearby Homes
- 25 Mills Dr
- 0 Ipswich St
- 0 Central Ave Unit 1398155
- 27 Aurelia Dr
- 0 Orchard St Unit 1396400
- 0 Orchard St Unit 1400488
- 0 Orchard St Unit 1395201
- 33 Prudence Ave
- 10 Mott St
- 33 Harding Ave
- 665 Plainfield St
- 649 Union Ave
- 54 Silver Lake Ave
- 6 Seton St
- 36 Moorefield St Unit 38
- 60 Ophelia St
- 161 Prudence Ave
- 27 Moorefield St
- 231 Lowell Ave
- 10 S Long St