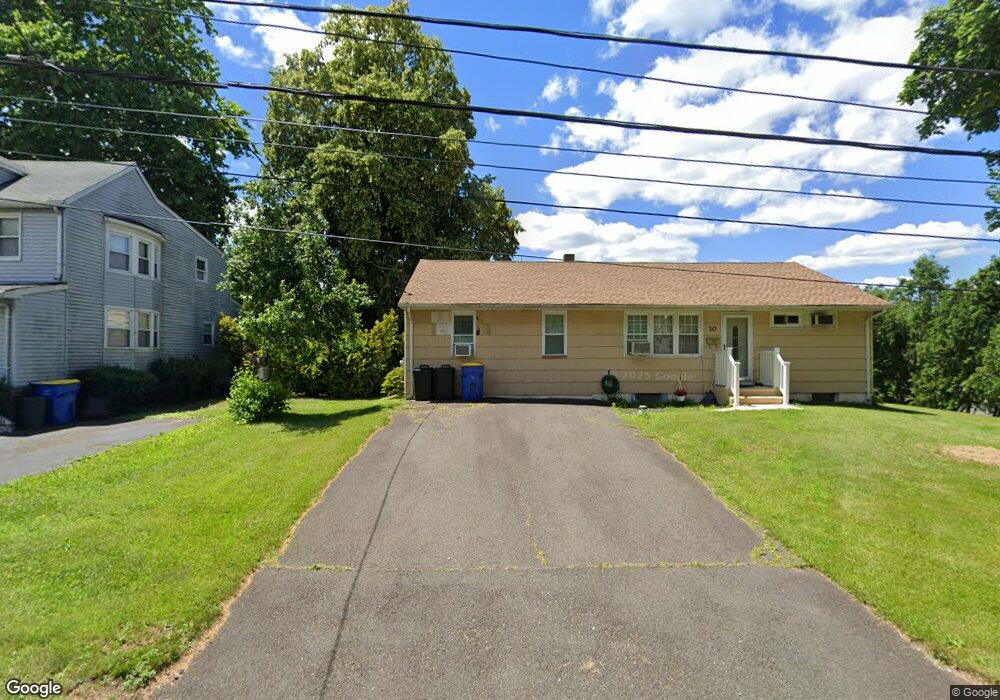
10 Equator Ave Unit 12 South Bound Brook, NJ 08880
Estimated Value: $427,546 - $496,000
--
Bed
--
Bath
1,344
Sq Ft
$344/Sq Ft
Est. Value
About This Home
This home is located at 10 Equator Ave Unit 12, South Bound Brook, NJ 08880 and is currently estimated at $462,137, approximately $343 per square foot. 10 Equator Ave Unit 12 is a home located in Somerset County with nearby schools including Robert Morris School and Green Brook Academy.
Ownership History
Date
Name
Owned For
Owner Type
Purchase Details
Closed on
Dec 29, 2017
Sold by
Fabian Bruce and The Estate Of Edith Fabian
Bought by
Fabian Laura N
Current Estimated Value
Home Financials for this Owner
Home Financials are based on the most recent Mortgage that was taken out on this home.
Original Mortgage
$110,200
Outstanding Balance
$92,900
Interest Rate
3.9%
Mortgage Type
New Conventional
Estimated Equity
$369,237
Purchase Details
Closed on
Aug 30, 2001
Sold by
Joseph Pone
Bought by
Ruce Fabian and Fabian Edith
Home Financials for this Owner
Home Financials are based on the most recent Mortgage that was taken out on this home.
Original Mortgage
$96,000
Interest Rate
7.05%
Purchase Details
Closed on
Jun 16, 1993
Sold by
Curto Alfred L and Curto Angelina
Bought by
Curto Alfred L and Curto Angelina
Create a Home Valuation Report for This Property
The Home Valuation Report is an in-depth analysis detailing your home's value as well as a comparison with similar homes in the area
Home Values in the Area
Average Home Value in this Area
Purchase History
| Date | Buyer | Sale Price | Title Company |
|---|---|---|---|
| Fabian Laura N | $137,750 | None Available | |
| Ruce Fabian | $120,000 | -- | |
| Curto Alfred L | -- | -- |
Source: Public Records
Mortgage History
| Date | Status | Borrower | Loan Amount |
|---|---|---|---|
| Open | Fabian Laura N | $110,200 | |
| Previous Owner | Ruce Fabian | $96,000 |
Source: Public Records
Tax History Compared to Growth
Tax History
| Year | Tax Paid | Tax Assessment Tax Assessment Total Assessment is a certain percentage of the fair market value that is determined by local assessors to be the total taxable value of land and additions on the property. | Land | Improvement |
|---|---|---|---|---|
| 2025 | $8,408 | $220,000 | $100,000 | $120,000 |
| 2024 | $8,408 | $220,000 | $100,000 | $120,000 |
| 2023 | $8,329 | $220,000 | $100,000 | $120,000 |
| 2022 | $7,784 | $220,000 | $100,000 | $120,000 |
| 2021 | $7,671 | $220,000 | $100,000 | $120,000 |
| 2020 | $7,297 | $220,000 | $100,000 | $120,000 |
| 2019 | $7,487 | $220,000 | $100,000 | $120,000 |
| 2018 | $7,445 | $220,000 | $100,000 | $120,000 |
| 2017 | $7,418 | $220,000 | $100,000 | $120,000 |
| 2016 | $7,251 | $220,000 | $100,000 | $120,000 |
| 2015 | $6,810 | $220,000 | $100,000 | $120,000 |
| 2014 | $7,095 | $234,500 | $112,100 | $122,400 |
Source: Public Records
Map
Nearby Homes
- 206 Bathgate Ave
- 208 Sanders Ave
- 165 Prospect St
- 2 Drake St
- 231 Beck Ave
- 123 Elizabeth St
- 34 van Keuren Ave Unit 38
- 40 van Keuren Ave Unit 42
- 105 La Monte Ave
- 126 W High St
- 130 W High St Unit 132
- 432 Talmage Ave
- 535 Madison Ave
- 102 W Franklin St
- 20 Patriots Path
- 542 Wheatland Ave
- 112 East St
- 320 Church St
- 71 Remsen St
- 112-114 E Union Ave