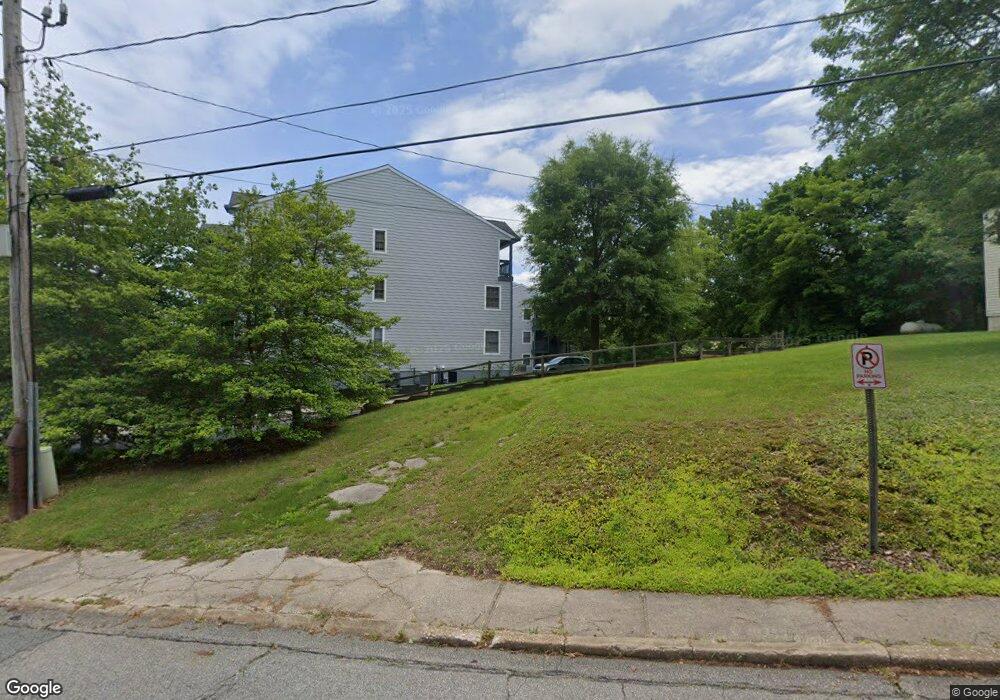
10 Ericsson Ave Betterton, MD 21610
Estimated Value: $318,588 - $365,000
Studio
2
Baths
1,620
Sq Ft
$212/Sq Ft
Est. Value
About This Home
This home is located at 10 Ericsson Ave, Betterton, MD 21610 and is currently estimated at $342,647, approximately $211 per square foot. 10 Ericsson Ave is a home located in Kent County with nearby schools including Kent County Middle School and Kent County High School.
Ownership History
Date
Name
Owned For
Owner Type
Purchase Details
Closed on
Aug 4, 2021
Sold by
Coyle Elizabeth M and Coyle Robert J
Bought by
Armstrong Lorraine Suzanne
Current Estimated Value
Home Financials for this Owner
Home Financials are based on the most recent Mortgage that was taken out on this home.
Original Mortgage
$216,000
Outstanding Balance
$196,704
Interest Rate
3%
Mortgage Type
New Conventional
Estimated Equity
$145,943
Purchase Details
Closed on
Jul 13, 2017
Sold by
Angelides Marica
Bought by
Coyle Elizabeth M and Burke Robert J
Home Financials for this Owner
Home Financials are based on the most recent Mortgage that was taken out on this home.
Original Mortgage
$197,600
Interest Rate
3.94%
Mortgage Type
New Conventional
Purchase Details
Closed on
Feb 18, 2010
Sold by
Shipe Ii Charles F and Shipe Santa P
Bought by
Angelides Marcia
Purchase Details
Closed on
Apr 3, 1998
Sold by
Hall Creek Land Company Inc
Bought by
Shipe Charles F
Create a Home Valuation Report for This Property
The Home Valuation Report is an in-depth analysis detailing your home's value as well as a comparison with similar homes in the area
Purchase History
| Date | Buyer | Sale Price | Title Company |
|---|---|---|---|
| Armstrong Lorraine Suzanne | $270,000 | None Available | |
| Coyle Elizabeth M | $208,000 | None Available | |
| Angelides Marcia | $225,000 | -- | |
| Shipe Charles F | $120,000 | -- |
Source: Public Records
Mortgage History
| Date | Status | Borrower | Loan Amount |
|---|---|---|---|
| Open | Armstrong Lorraine Suzanne | $216,000 | |
| Previous Owner | Coyle Elizabeth M | $197,600 |
Source: Public Records
Tax History
| Year | Tax Paid | Tax Assessment Tax Assessment Total Assessment is a certain percentage of the fair market value that is determined by local assessors to be the total taxable value of land and additions on the property. | Land | Improvement |
|---|---|---|---|---|
| 2025 | $3,703 | $255,000 | $130,000 | $125,000 |
| 2024 | $3,388 | $233,333 | $0 | $0 |
| 2023 | $3,074 | $211,667 | $0 | $0 |
| 2022 | $2,740 | $190,000 | $117,300 | $72,700 |
| 2020 | $2,759 | $190,000 | $117,300 | $72,700 |
| 2019 | $6,323 | $217,700 | $145,000 | $72,700 |
| 2018 | $3,161 | $217,700 | $145,000 | $72,700 |
| 2017 | $3,165 | $217,700 | $0 | $0 |
| 2016 | -- | $217,700 | $0 | $0 |
| 2015 | $3,165 | $217,700 | $0 | $0 |
| 2014 | $3,165 | $217,700 | $0 | $0 |
Source: Public Records
Map
Nearby Homes
- 1 Idlewhile Ave Unit 4
- 0 1st Ave
- 201 Ericsson Ave
- 21 6th Ave
- 13699 Still Pond Rd
- 0 Dutchtown Rd
- 0 Blackmon Ln
- 302 Cecil Ave
- 25619 W Hill Rd
- 110 Rhode Island Ave
- 0 Ohio Ave
- 24 Ches Haven Rd
- 26670 Maple Ave
- 0 Main St
- 26663 Maple Ave
- 0 Medders Rd
- 12733 Still Pond Rd
- 25209 Wymont Park Rd
- 12400 Woods Rd
- 0 Still Pond Creek Rd Unit MDKE2005888
- 10 Ericsson Ave Unit 33
- 10 Ericsson Ave Unit 26
- 10 Ericsson Ave Unit 22
- 10 Ericsson Ave
- 10 Ericsson Ave
- 10 Ericsson Ave
- 10 Ericsson Ave
- 10 Ericsson Ave
- 10 Ericsson Ave
- 10 Ericsson Ave
- 10 Ericsson Ave
- 10 Ericsson Ave
- 10 Ericsson Ave
- 10 Ericsson Ave
- 10 Ericsson Ave
- 10 Ericsson Ave
- 10 Ericsson Ave
- 10 Ericsson Ave
- 10 Ericsson Ave
- 10 Ericsson Ave Unit 34
Your Personal Tour Guide
Ask me questions while you tour the home.