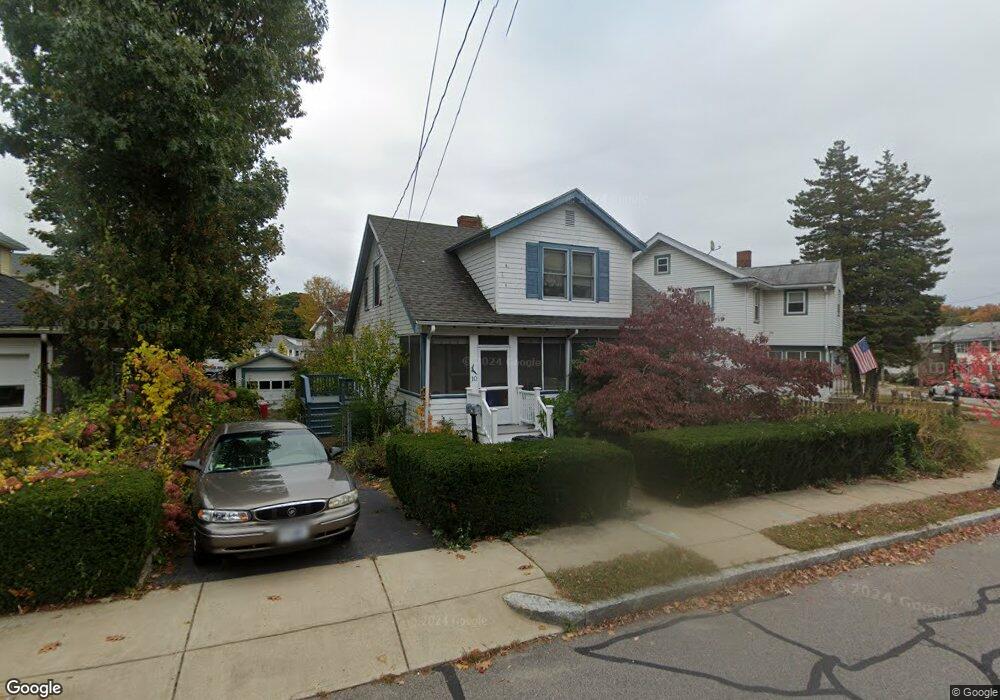
10 Estabrook Rd Quincy, MA 02170
Wollaston NeighborhoodEstimated Value: $638,000 - $746,000
3
Beds
2
Baths
1,421
Sq Ft
$495/Sq Ft
Est. Value
About This Home
This home is located at 10 Estabrook Rd, Quincy, MA 02170 and is currently estimated at $702,985, approximately $494 per square foot. 10 Estabrook Rd is a home located in Norfolk County with nearby schools including Beechwood Knoll Elementary School, Central Middle School, and North Quincy High School.
Ownership History
Date
Name
Owned For
Owner Type
Purchase Details
Closed on
Mar 10, 2023
Sold by
Mahn Teresa
Bought by
Estabrook Road Rt and Mcdonagh
Current Estimated Value
Home Financials for this Owner
Home Financials are based on the most recent Mortgage that was taken out on this home.
Original Mortgage
$1
Outstanding Balance
$1
Interest Rate
6.12%
Mortgage Type
New Conventional
Purchase Details
Closed on
Dec 2, 2021
Sold by
Obrien Dorothy Est and Mahn
Bought by
Lupo Francis and Mahn Teresa
Create a Home Valuation Report for This Property
The Home Valuation Report is an in-depth analysis detailing your home's value as well as a comparison with similar homes in the area
Home Values in the Area
Average Home Value in this Area
Purchase History
| Date | Buyer | Sale Price | Title Company |
|---|---|---|---|
| Estabrook Road Rt | -- | None Available | |
| Estabrook Road Rt | -- | None Available | |
| Estabrook Road Rt | -- | None Available | |
| Mahn Teresa | $275,000 | None Available | |
| Mahn Teresa | $275,000 | None Available | |
| Lupo Francis | -- | None Available | |
| Lupo Francis | -- | None Available |
Source: Public Records
Mortgage History
| Date | Status | Borrower | Loan Amount |
|---|---|---|---|
| Open | Mahn Teresa | $1 | |
| Closed | Mahn Teresa | $1 | |
| Closed | Estabrook Road Rt | $0 | |
| Closed | Estabrook Road Rt | $0 |
Source: Public Records
Tax History Compared to Growth
Tax History
| Year | Tax Paid | Tax Assessment Tax Assessment Total Assessment is a certain percentage of the fair market value that is determined by local assessors to be the total taxable value of land and additions on the property. | Land | Improvement |
|---|---|---|---|---|
| 2025 | $6,791 | $589,000 | $333,800 | $255,200 |
| 2024 | $6,613 | $586,800 | $333,800 | $253,000 |
| 2023 | $6,174 | $554,700 | $317,900 | $236,800 |
| 2022 | $5,774 | $482,000 | $254,300 | $227,700 |
| 2021 | $5,750 | $473,600 | $254,300 | $219,300 |
| 2020 | $6,025 | $484,700 | $254,300 | $230,400 |
| 2019 | $5,305 | $422,700 | $237,700 | $185,000 |
| 2018 | $5,259 | $394,200 | $216,100 | $178,100 |
| 2017 | $5,471 | $386,100 | $216,100 | $170,000 |
| 2016 | $5,233 | $364,400 | $196,400 | $168,000 |
| 2015 | $4,780 | $327,400 | $178,600 | $148,800 |
| 2014 | $4,461 | $300,200 | $170,100 | $130,100 |
Source: Public Records
Map
Nearby Homes
- 35 Estabrook Rd
- 72 Waterston Ave
- 163 Clay St Unit C
- 22 Newton Ave
- 100 Thornton St
- 123 Waterston Ave
- 55 Warren Ave
- 22 Beach St
- 165 Old Colony Ave Unit A
- 14 Ridgeway St
- 29 Oval Rd
- 111 Warren Ave Unit 1F
- 365 Newport Ave Unit 301
- 101 Beach St
- 129 Grand View Ave
- 54 Hudson St
- 65 - 67 Davis St
- 129 Beale St
- 43 Ellington Rd
- 57 Willow Ave