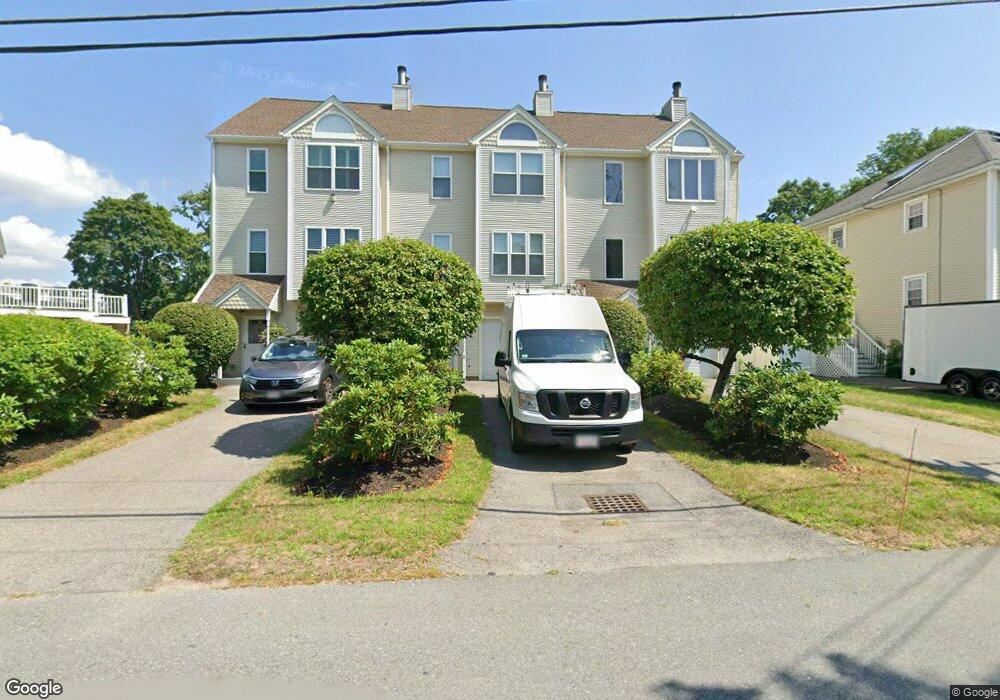
10 Eugene St Lowell, MA 01852
South Lowell NeighborhoodEstimated Value: $476,000 - $552,000
4
Beds
1
Bath
1,712
Sq Ft
$294/Sq Ft
Est. Value
About This Home
This home is located at 10 Eugene St, Lowell, MA 01852 and is currently estimated at $503,525, approximately $294 per square foot. 10 Eugene St is a home located in Middlesex County with nearby schools including Moody Elementary School, Abraham Lincoln Elementary School, and Greenhalge Elementary School.
Ownership History
Date
Name
Owned For
Owner Type
Purchase Details
Closed on
Sep 26, 2022
Sold by
Mary Lee 2018 Lt and Lee
Bought by
Lee Mary
Current Estimated Value
Home Financials for this Owner
Home Financials are based on the most recent Mortgage that was taken out on this home.
Original Mortgage
$136,000
Outstanding Balance
$130,411
Interest Rate
5.55%
Mortgage Type
Stand Alone Refi Refinance Of Original Loan
Estimated Equity
$373,114
Purchase Details
Closed on
Jan 25, 2018
Sold by
Lee Mary
Bought by
Mary Lee 2018 Lt and Lee
Purchase Details
Closed on
May 30, 2006
Sold by
Comeau Robin
Bought by
Lee Mary
Home Financials for this Owner
Home Financials are based on the most recent Mortgage that was taken out on this home.
Original Mortgage
$197,600
Interest Rate
6.53%
Mortgage Type
Purchase Money Mortgage
Purchase Details
Closed on
Nov 17, 2000
Sold by
Zaharakes Nancy L and Vieira Nancy
Bought by
Comeau Robin
Purchase Details
Closed on
Jun 10, 1987
Sold by
Okeefe Michael T
Bought by
Zoharakes Nancy L
Create a Home Valuation Report for This Property
The Home Valuation Report is an in-depth analysis detailing your home's value as well as a comparison with similar homes in the area
Home Values in the Area
Average Home Value in this Area
Purchase History
| Date | Buyer | Sale Price | Title Company |
|---|---|---|---|
| Lee Mary | -- | None Available | |
| Lee Mary | -- | None Available | |
| Mary Lee 2018 Lt | -- | -- | |
| Mary Lee 2018 Lt | -- | -- | |
| Lee Mary | $247,000 | -- | |
| Lee Mary | $247,000 | -- | |
| Comeau Robin | $150,000 | -- | |
| Comeau Robin | $150,000 | -- | |
| Zoharakes Nancy L | $125,000 | -- |
Source: Public Records
Mortgage History
| Date | Status | Borrower | Loan Amount |
|---|---|---|---|
| Open | Lee Mary | $136,000 | |
| Closed | Lee Mary | $136,000 | |
| Previous Owner | Zoharakes Nancy L | $195,826 | |
| Previous Owner | Lee Mary | $197,600 |
Source: Public Records
Tax History
| Year | Tax Paid | Tax Assessment Tax Assessment Total Assessment is a certain percentage of the fair market value that is determined by local assessors to be the total taxable value of land and additions on the property. | Land | Improvement |
|---|---|---|---|---|
| 2025 | $4,647 | $404,800 | $0 | $404,800 |
| 2024 | $4,095 | $343,800 | $0 | $343,800 |
| 2023 | $3,776 | $304,000 | $0 | $304,000 |
| 2022 | $3,683 | $290,200 | $0 | $290,200 |
| 2021 | $3,504 | $260,300 | $0 | $260,300 |
| 2020 | $3,369 | $252,200 | $0 | $252,200 |
| 2019 | $3,292 | $234,500 | $0 | $234,500 |
| 2018 | $3,100 | $215,400 | $0 | $215,400 |
| 2017 | $3,085 | $206,800 | $0 | $206,800 |
| 2016 | $2,926 | $193,000 | $0 | $193,000 |
| 2015 | $2,817 | $182,000 | $0 | $182,000 |
| 2013 | $2,625 | $174,900 | $0 | $174,900 |
Source: Public Records
Map
Nearby Homes
- 14 Warnock St
- 1204 Lawrence St
- 74 Felton St Unit A
- 106 Lundberg St Unit 6
- 36 Crowley St
- 1400 Gorham St Unit 42
- 1400 Gorham St Unit 32
- 1400 Gorham St Unit 46
- 900 Lawrence St Unit 5
- 5 Lenox St Unit 2
- 5 Lenox St Unit 4
- 1514 Gorham St Unit 4
- 74 Carlisle St
- 7 Gorham St Unit 54
- 7 Gorham St Unit 36
- 810 Lawrence St Unit C
- 29 Gorham St
- 21 Agawam St
- 39 Moore St
- 53 Gorham St
- 14 Eugene St
- 12 Eugene St
- 14 Eugene St Unit 14
- 12 Eugene St Unit 12
- 12 Eugene St Unit 12 1
- 10 Eugene St
- 120 Billerica St
- 112 Billerica St
- 20 Eugene St
- 18 Eugene St Unit 20
- 128 Billerica St
- 121 Billerica St
- 106 Billerica St
- 19 Eugene St
- 21 Eugene St
- 30 Eugene St
- 100 Billerica St
- 27 Eugene St
- 15 Stavely St
- 29 Stavely St
Your Personal Tour Guide
Ask me questions while you tour the home.