10 Everett St Sherborn, MA 01770
Estimated Value: $1,180,000 - $1,356,653
3
Beds
3
Baths
2,750
Sq Ft
$473/Sq Ft
Est. Value
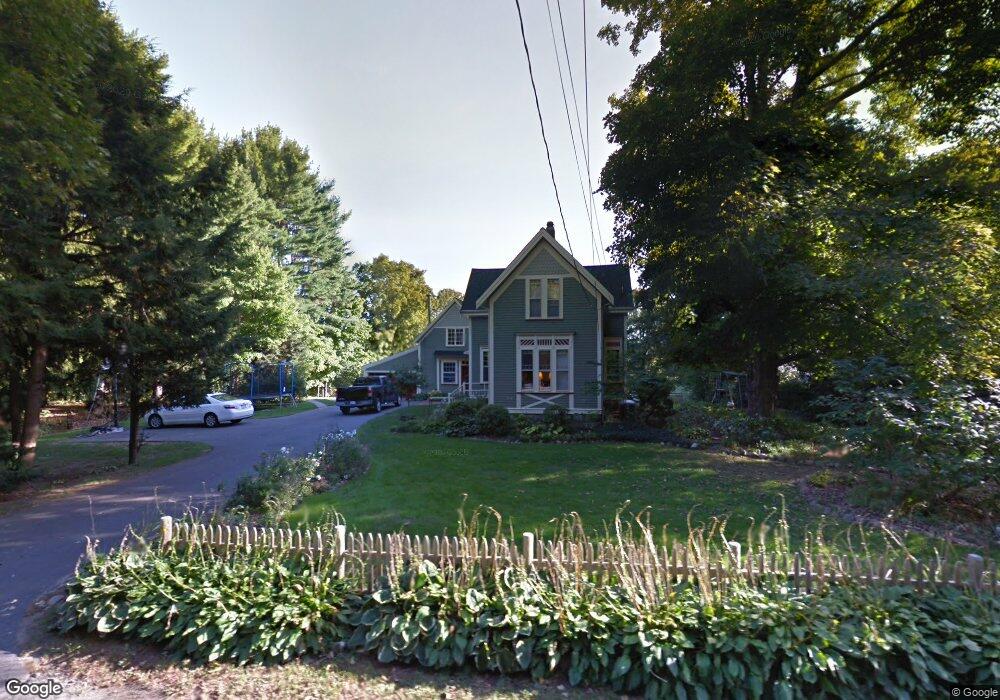
About This Home
This home is located at 10 Everett St, Sherborn, MA 01770 and is currently estimated at $1,301,163, approximately $473 per square foot. 10 Everett St is a home located in Middlesex County with nearby schools including Pine Hill Elementary School, Dover-Sherborn Regional Middle School, and Dover-Sherborn Regional High School.
Ownership History
Date
Name
Owned For
Owner Type
Purchase Details
Closed on
Sep 28, 1993
Sold by
Wolf Richard J and Wolf Chalfant S
Bought by
Moore Valerie L
Current Estimated Value
Home Financials for this Owner
Home Financials are based on the most recent Mortgage that was taken out on this home.
Original Mortgage
$265,500
Interest Rate
7.1%
Mortgage Type
Purchase Money Mortgage
Create a Home Valuation Report for This Property
The Home Valuation Report is an in-depth analysis detailing your home's value as well as a comparison with similar homes in the area
Home Values in the Area
Average Home Value in this Area
Purchase History
| Date | Buyer | Sale Price | Title Company |
|---|---|---|---|
| Moore Valerie L | $295,000 | -- |
Source: Public Records
Mortgage History
| Date | Status | Borrower | Loan Amount |
|---|---|---|---|
| Open | Moore Valerie L | $258,900 | |
| Closed | Moore Valerie L | $265,500 | |
| Previous Owner | Moore Valerie L | $180,000 |
Source: Public Records
Tax History
| Year | Tax Paid | Tax Assessment Tax Assessment Total Assessment is a certain percentage of the fair market value that is determined by local assessors to be the total taxable value of land and additions on the property. | Land | Improvement |
|---|---|---|---|---|
| 2025 | $20,854 | $1,257,800 | $455,700 | $802,100 |
| 2024 | $20,976 | $1,237,500 | $438,300 | $799,200 |
| 2023 | $20,063 | $1,114,000 | $438,300 | $675,700 |
| 2022 | $18,779 | $986,800 | $425,200 | $561,600 |
| 2021 | $4,508 | $986,800 | $425,200 | $561,600 |
| 2020 | $18,674 | $959,600 | $425,200 | $534,400 |
| 2019 | $18,294 | $932,400 | $425,200 | $507,200 |
| 2018 | $17,995 | $932,400 | $425,200 | $507,200 |
| 2017 | $17,800 | $870,000 | $420,200 | $449,800 |
| 2016 | $17,382 | $845,000 | $395,200 | $449,800 |
| 2015 | $17,073 | $840,200 | $385,200 | $455,000 |
| 2014 | $17,126 | $842,000 | $375,100 | $466,900 |
Source: Public Records
Map
Nearby Homes
- 7 Allison Way Unit 7
- 11 Morgan Dr Unit 404
- 1 Fern St
- 6 Hopewell Farm Rd
- 16 Wayside Rd Unit 14
- 28 Sylvester Rd
- 62 Oakland St
- 5 Lanes End
- 303 Eliot St
- 216-218 S Main St
- 16 West St
- 79 Speen St
- 14 Pinewood Ave
- 137 Lake St
- 5 Farm Rd
- 65 Farm Road Lot 6
- 25 Forest Ave
- 6 Floral Avenue Extension
- 34 Walden Dr Unit 5
- 30 Walden Dr Unit 7
Your Personal Tour Guide
Ask me questions while you tour the home.