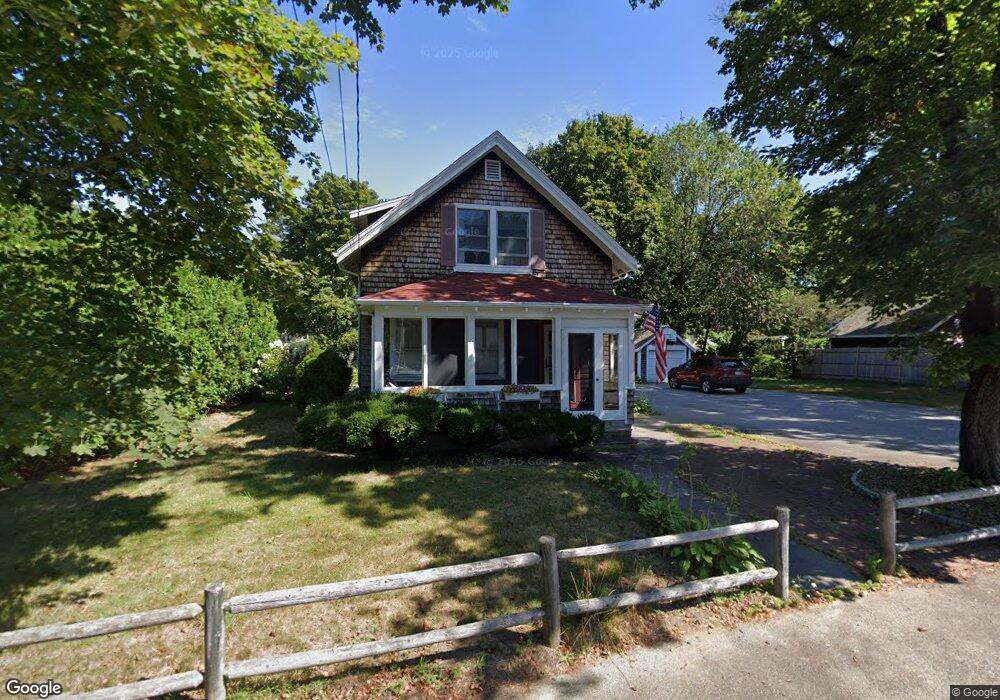
10 Fairview St Hingham, MA 02043
Estimated Value: $823,364 - $970,000
3
Beds
2
Baths
1,165
Sq Ft
$772/Sq Ft
Est. Value
About This Home
This home is located at 10 Fairview St, Hingham, MA 02043 and is currently estimated at $899,841, approximately $772 per square foot. 10 Fairview St is a home located in Plymouth County with nearby schools including East Elementary School, Hingham Middle School, and Hingham High School.
Ownership History
Date
Name
Owned For
Owner Type
Purchase Details
Closed on
Nov 21, 2011
Sold by
Perry Mary C and Perry Daniel B
Bought by
Perry Mary C
Current Estimated Value
Home Financials for this Owner
Home Financials are based on the most recent Mortgage that was taken out on this home.
Original Mortgage
$130,000
Outstanding Balance
$86,906
Interest Rate
3.92%
Mortgage Type
Purchase Money Mortgage
Estimated Equity
$812,935
Purchase Details
Closed on
Jul 12, 1984
Bought by
Perry Mary C
Create a Home Valuation Report for This Property
The Home Valuation Report is an in-depth analysis detailing your home's value as well as a comparison with similar homes in the area
Purchase History
| Date | Buyer | Sale Price | Title Company |
|---|---|---|---|
| Perry Mary C | -- | -- | |
| Perry Mary C | $100,000 | -- |
Source: Public Records
Mortgage History
| Date | Status | Borrower | Loan Amount |
|---|---|---|---|
| Open | Perry Mary C | $130,000 | |
| Previous Owner | Perry Mary C | $135,000 | |
| Previous Owner | Perry Mary C | $125,000 | |
| Previous Owner | Perry Mary C | $25,000 |
Source: Public Records
Tax History
| Year | Tax Paid | Tax Assessment Tax Assessment Total Assessment is a certain percentage of the fair market value that is determined by local assessors to be the total taxable value of land and additions on the property. | Land | Improvement |
|---|---|---|---|---|
| 2025 | $7,536 | $705,000 | $456,100 | $248,900 |
| 2024 | $7,088 | $653,300 | $456,100 | $197,200 |
| 2023 | $6,429 | $642,900 | $456,100 | $186,800 |
| 2022 | $6,553 | $566,900 | $380,100 | $186,800 |
| 2021 | $6,427 | $544,700 | $380,100 | $164,600 |
| 2020 | $6,280 | $544,700 | $380,100 | $164,600 |
| 2019 | $4,815 | $487,200 | $334,500 | $152,700 |
| 2018 | $5,666 | $481,400 | $334,500 | $146,900 |
| 2017 | $4,496 | $466,700 | $327,500 | $139,200 |
| 2016 | $5,607 | $448,900 | $312,000 | $136,900 |
| 2015 | $5,364 | $428,100 | $297,100 | $131,000 |
Source: Public Records
Map
Nearby Homes