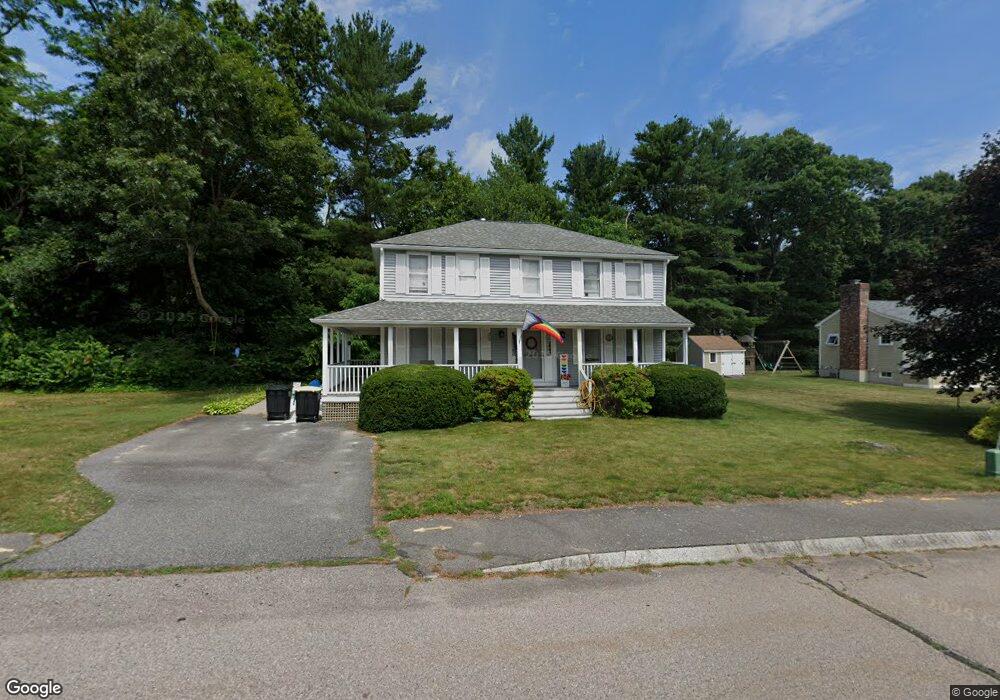
10 Fieldcrest Dr Bridgewater, MA 02324
Estimated Value: $625,456 - $756,000
3
Beds
2
Baths
1,872
Sq Ft
$366/Sq Ft
Est. Value
About This Home
This home is located at 10 Fieldcrest Dr, Bridgewater, MA 02324 and is currently estimated at $685,114, approximately $365 per square foot. 10 Fieldcrest Dr is a home located in Plymouth County with nearby schools including Mitchell Elementary School, Williams Intermediate School, and Bridgewater Middle School.
Ownership History
Date
Name
Owned For
Owner Type
Purchase Details
Closed on
Dec 19, 2019
Sold by
Buohl Keith J and Buohl Carol A
Bought by
Buohl Ft
Current Estimated Value
Purchase Details
Closed on
May 3, 1994
Sold by
Briarwood Constr Corp
Bought by
Buohl Keith J and Buohl Carol A
Home Financials for this Owner
Home Financials are based on the most recent Mortgage that was taken out on this home.
Original Mortgage
$85,000
Interest Rate
7.7%
Mortgage Type
Purchase Money Mortgage
Create a Home Valuation Report for This Property
The Home Valuation Report is an in-depth analysis detailing your home's value as well as a comparison with similar homes in the area
Home Values in the Area
Average Home Value in this Area
Purchase History
| Date | Buyer | Sale Price | Title Company |
|---|---|---|---|
| Buohl Ft | -- | None Available | |
| Buohl Keith J | $164,900 | -- |
Source: Public Records
Mortgage History
| Date | Status | Borrower | Loan Amount |
|---|---|---|---|
| Previous Owner | Buohl Keith J | $115,000 | |
| Previous Owner | Buohl Keith J | $125,000 | |
| Previous Owner | Buohl Keith J | $98,100 | |
| Previous Owner | Buohl Keith J | $85,000 |
Source: Public Records
Tax History
| Year | Tax Paid | Tax Assessment Tax Assessment Total Assessment is a certain percentage of the fair market value that is determined by local assessors to be the total taxable value of land and additions on the property. | Land | Improvement |
|---|---|---|---|---|
| 2025 | $6,524 | $551,500 | $225,200 | $326,300 |
| 2024 | $6,343 | $522,500 | $214,500 | $308,000 |
| 2023 | $6,322 | $492,400 | $200,400 | $292,000 |
| 2022 | $6,192 | $432,400 | $175,900 | $256,500 |
| 2021 | $5,591 | $386,100 | $157,000 | $229,100 |
| 2020 | $5,509 | $374,000 | $151,000 | $223,000 |
| 2019 | $5,392 | $363,600 | $151,000 | $212,600 |
| 2018 | $5,193 | $341,900 | $146,600 | $195,300 |
| 2017 | $5,048 | $323,400 | $146,600 | $176,800 |
| 2016 | $4,807 | $309,300 | $143,800 | $165,500 |
| 2015 | $4,836 | $297,800 | $139,500 | $158,300 |
| 2014 | $4,732 | $291,200 | $135,400 | $155,800 |
Source: Public Records
Map
Nearby Homes
- 0 Three Rivers Dr
- 11 Satucket Trail
- 114 Plain St
- 215 Whitman St
- Lot 1 Mill St
- 81 Arrowhead Dr
- 225 Whitman St
- 67 Country Dr
- 150 Prattown Ln
- 5 Country Dr
- 845 Plymouth St
- 24 High Pond Dr
- 398 Plymouth St
- 94 Pond St
- 3 Caswell Way
- 1397 Plymouth St Unit 1397
- 1617 Plymouth St Unit 3
- 1617 Plymouth St
- 20 Church Ave
- 580 Broad St Unit 2
Your Personal Tour Guide
Ask me questions while you tour the home.