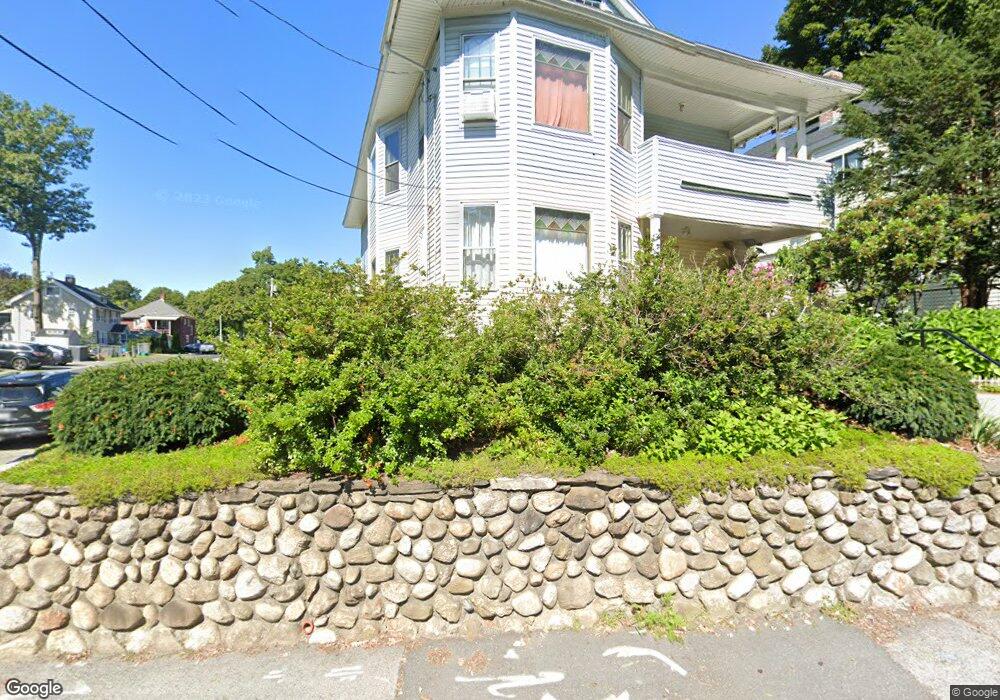
10 Flagg St Worcester, MA 01602
Newton Square NeighborhoodEstimated Value: $561,040 - $648,000
6
Beds
2
Baths
2,730
Sq Ft
$224/Sq Ft
Est. Value
About This Home
This home is located at 10 Flagg St, Worcester, MA 01602 and is currently estimated at $612,260, approximately $224 per square foot. 10 Flagg St is a home located in Worcester County with nearby schools including Chandler Magnet, Jacob Hiatt Magnet School, and Flagg Street School.
Ownership History
Date
Name
Owned For
Owner Type
Purchase Details
Closed on
May 15, 2017
Sold by
Haringa Jack M and Haringa Tomomi A
Bought by
Callo Erion and Callo Esmeralda
Current Estimated Value
Home Financials for this Owner
Home Financials are based on the most recent Mortgage that was taken out on this home.
Original Mortgage
$251,750
Outstanding Balance
$207,583
Interest Rate
4.14%
Mortgage Type
New Conventional
Estimated Equity
$404,677
Create a Home Valuation Report for This Property
The Home Valuation Report is an in-depth analysis detailing your home's value as well as a comparison with similar homes in the area
Home Values in the Area
Average Home Value in this Area
Purchase History
| Date | Buyer | Sale Price | Title Company |
|---|---|---|---|
| Callo Erion | $265,000 | -- |
Source: Public Records
Mortgage History
| Date | Status | Borrower | Loan Amount |
|---|---|---|---|
| Open | Callo Erion | $251,750 |
Source: Public Records
Tax History
| Year | Tax Paid | Tax Assessment Tax Assessment Total Assessment is a certain percentage of the fair market value that is determined by local assessors to be the total taxable value of land and additions on the property. | Land | Improvement |
|---|---|---|---|---|
| 2025 | $6,971 | $528,500 | $106,300 | $422,200 |
| 2024 | $6,623 | $481,700 | $106,300 | $375,400 |
| 2023 | $6,178 | $430,800 | $91,600 | $339,200 |
| 2022 | $5,690 | $374,100 | $73,200 | $300,900 |
| 2021 | $5,198 | $319,300 | $58,600 | $260,700 |
| 2020 | $4,864 | $286,100 | $58,500 | $227,600 |
| 2019 | $4,952 | $275,100 | $56,300 | $218,800 |
| 2018 | $4,843 | $256,100 | $56,300 | $199,800 |
| 2017 | $3,535 | $183,900 | $56,300 | $127,600 |
| 2016 | $3,551 | $172,300 | $46,900 | $125,400 |
| 2015 | $3,458 | $172,300 | $46,900 | $125,400 |
| 2014 | $3,367 | $172,300 | $46,900 | $125,400 |
Source: Public Records
Map
Nearby Homes
- 19 Kenilworth Rd
- 31 Lenox St
- 22 Audubon Rd
- 18 Merlin Ct Unit 18
- 85 Camelot Dr Unit 118
- 12 Cardinal Rd
- 23 Orrison St
- 118 Beaconsfield Rd
- 16 Sherwood Rd
- 122 Copperfield Rd
- 32 Aylesbury Rd
- 18 Hadwen Ln
- 7 Longworth Rd
- 163 Moreland St
- 9 Dennison Rd
- 23 Tiverton Pkwy
- 93 Newton Ave N
- 3A Chalmers Rd
- 83 Newton Ave N
- 24 Hadwen Rd
Your Personal Tour Guide
Ask me questions while you tour the home.