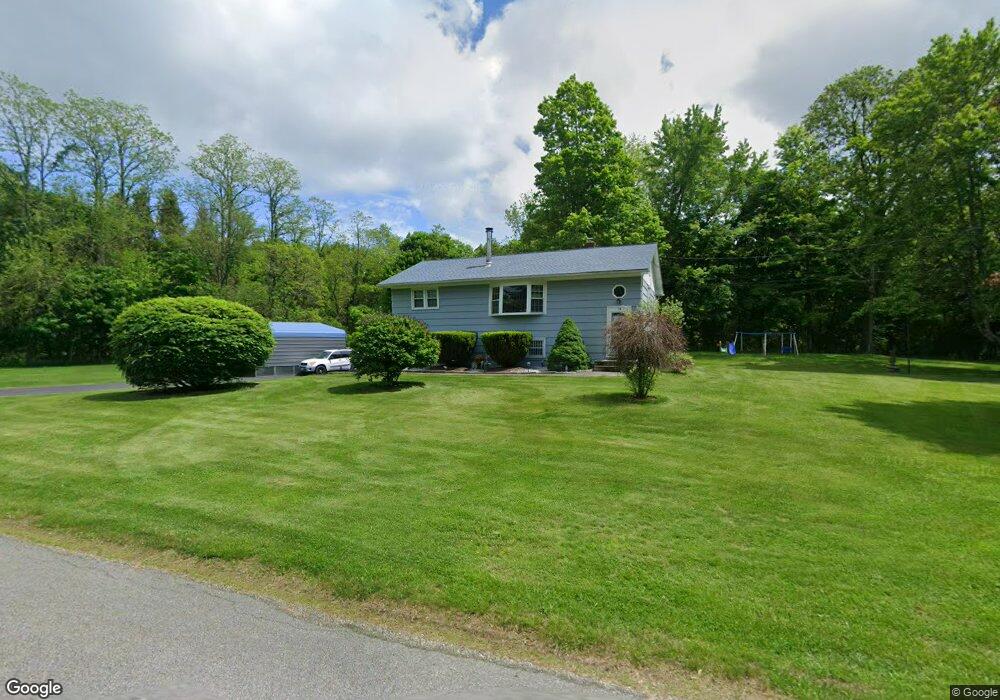
10 Flagler Rd Hopewell Junction, NY 12533
Estimated Value: $417,000 - $484,000
3
Beds
2
Baths
1,040
Sq Ft
$422/Sq Ft
Est. Value
About This Home
This home is located at 10 Flagler Rd, Hopewell Junction, NY 12533 and is currently estimated at $439,232, approximately $422 per square foot. 10 Flagler Rd is a home located in Dutchess County with nearby schools including Myers Corners Elementary School, Van Wyck Junior High School, and John Jay Senior High School.
Ownership History
Date
Name
Owned For
Owner Type
Purchase Details
Closed on
Feb 4, 2005
Sold by
Matteo John
Bought by
Matteo Frank
Current Estimated Value
Home Financials for this Owner
Home Financials are based on the most recent Mortgage that was taken out on this home.
Original Mortgage
$15,000
Outstanding Balance
$2,493
Interest Rate
5.78%
Mortgage Type
Purchase Money Mortgage
Estimated Equity
$436,739
Purchase Details
Closed on
Nov 6, 2000
Sold by
Duffelmeyer Michael
Bought by
Matteo John
Create a Home Valuation Report for This Property
The Home Valuation Report is an in-depth analysis detailing your home's value as well as a comparison with similar homes in the area
Home Values in the Area
Average Home Value in this Area
Purchase History
| Date | Buyer | Sale Price | Title Company |
|---|---|---|---|
| Matteo Frank | -- | -- | |
| Matteo John | $165,000 | Patrick Mark |
Source: Public Records
Mortgage History
| Date | Status | Borrower | Loan Amount |
|---|---|---|---|
| Open | Matteo Frank | $15,000 |
Source: Public Records
Tax History Compared to Growth
Tax History
| Year | Tax Paid | Tax Assessment Tax Assessment Total Assessment is a certain percentage of the fair market value that is determined by local assessors to be the total taxable value of land and additions on the property. | Land | Improvement |
|---|---|---|---|---|
| 2024 | $5,157 | $331,000 | $65,000 | $266,000 |
| 2023 | $8,197 | $312,100 | $65,000 | $247,100 |
| 2022 | $8,083 | $283,700 | $65,000 | $218,700 |
| 2021 | $7,407 | $253,300 | $65,000 | $188,300 |
| 2020 | $5,165 | $234,500 | $65,000 | $169,500 |
| 2019 | $4,197 | $234,500 | $65,000 | $169,500 |
| 2018 | $4,010 | $221,200 | $65,000 | $156,200 |
| 2017 | $3,363 | $194,800 | $65,000 | $129,800 |
| 2016 | $4,105 | $194,800 | $65,000 | $129,800 |
| 2015 | -- | $194,800 | $65,000 | $129,800 |
| 2014 | -- | $194,800 | $65,000 | $129,800 |
Source: Public Records
Map
Nearby Homes