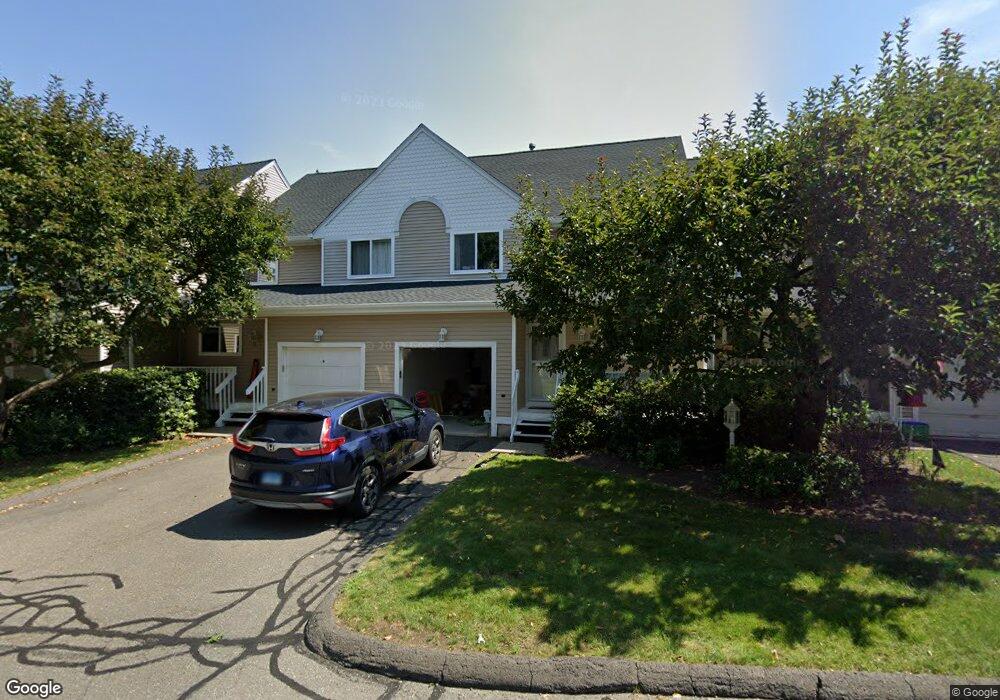
10 Florence Way Farmington, CT 06032
Estimated Value: $377,000 - $464,000
2
Beds
4
Baths
1,700
Sq Ft
$245/Sq Ft
Est. Value
About This Home
This home is located at 10 Florence Way, Farmington, CT 06032 and is currently estimated at $416,769, approximately $245 per square foot. 10 Florence Way is a home located in Hartford County with nearby schools including West Woods Upper Elementary School, Noah Wallace School, and Irving A. Robbins Middle School.
Ownership History
Date
Name
Owned For
Owner Type
Purchase Details
Closed on
Mar 19, 2015
Sold by
Gorecki Thomas
Bought by
Lakkapragada Srinivasa K
Current Estimated Value
Purchase Details
Closed on
Jun 29, 2009
Sold by
Reizian Nancy
Bought by
Gorecki Thomas
Home Financials for this Owner
Home Financials are based on the most recent Mortgage that was taken out on this home.
Original Mortgage
$188,000
Interest Rate
4.92%
Purchase Details
Closed on
Nov 17, 2006
Sold by
Medvedovskaya Galina
Bought by
Reizian Nancy
Purchase Details
Closed on
Sep 27, 2001
Sold by
Verrastro Lorna P
Bought by
Medvedouskiy Gennadiy and Medvedouskiy Galina
Purchase Details
Closed on
Jul 1, 1997
Sold by
Younger Joanne S
Bought by
Verrastro Lorna P
Purchase Details
Closed on
Sep 1, 1994
Sold by
Southwest Vlg Farm Lp
Bought by
Younger Joanne S
Create a Home Valuation Report for This Property
The Home Valuation Report is an in-depth analysis detailing your home's value as well as a comparison with similar homes in the area
Home Values in the Area
Average Home Value in this Area
Purchase History
| Date | Buyer | Sale Price | Title Company |
|---|---|---|---|
| Lakkapragada Srinivasa K | $236,500 | -- | |
| Gorecki Thomas | $257,500 | -- | |
| Reizian Nancy | $268,500 | -- | |
| Medvedouskiy Gennadiy | $180,000 | -- | |
| Verrastro Lorna P | $127,000 | -- | |
| Younger Joanne S | $135,000 | -- |
Source: Public Records
Mortgage History
| Date | Status | Borrower | Loan Amount |
|---|---|---|---|
| Previous Owner | Younger Joanne S | $182,000 | |
| Previous Owner | Younger Joanne S | $188,000 |
Source: Public Records
Tax History Compared to Growth
Tax History
| Year | Tax Paid | Tax Assessment Tax Assessment Total Assessment is a certain percentage of the fair market value that is determined by local assessors to be the total taxable value of land and additions on the property. | Land | Improvement |
|---|---|---|---|---|
| 2025 | $5,676 | $213,220 | $0 | $213,220 |
| 2024 | $5,426 | $213,220 | $0 | $213,220 |
| 2023 | $5,162 | $213,220 | $0 | $213,220 |
| 2022 | $5,031 | $171,580 | $0 | $171,580 |
| 2021 | $4,943 | $171,580 | $0 | $171,580 |
| 2020 | $4,799 | $171,580 | $0 | $171,580 |
| 2019 | $4,799 | $171,580 | $0 | $171,580 |
| 2018 | $4,664 | $171,580 | $0 | $171,580 |
| 2017 | $4,092 | $153,360 | $0 | $153,360 |
| 2016 | $3,954 | $153,360 | $0 | $153,360 |
| 2015 | $3,836 | $153,360 | $0 | $153,360 |
| 2014 | $3,748 | $153,360 | $0 | $153,360 |
Source: Public Records
Map
Nearby Homes
- 51 Songbird Ln
- 116 Songbird Ln Unit 116
- 16 Cardinal Dr
- 5 Shirley Ct
- 1469 Farmington Ave Unit 58
- 23 Bel Aire Dr
- 1325 Farmington Ave Unit 2
- 1325 Farmington Ave Unit 52
- 18 Timber Hill Rd
- 5 Peach Orchard Hill
- 0 Overlook Dr Unit Lot 3 24092446
- 0 Overlook Dr Unit Lot 4 24092448
- 59 Brace Ave
- 245 Mark St
- 43 Hiltbrand Rd Unit 2-11
- 44 Cabot St
- 158 Mark St
- 88 Rosemary Ln
- 73 Rosemary Ln
- 16 Cherry Hill Dr
- 10 Florence Way Unit 10
- 8 Florence Way
- 12 Florence Way
- 11 Florence Way
- 11 Florence Way Unit 11
- 9 Florence Way
- 7 Florence Way
- 6 Florence Way
- 6 Florence Way Unit 6
- 5 Florence Way
- 84 Florence Way
- 83 Florence Way
- 82 Florence Way
- 81 Florence Way
- 80 Florence Way
- 81 Florence Way Unit 81
- 83 Florence Way Unit 83
- 79 Florence Way
- 4 Florence Way
- 3 Florence Way