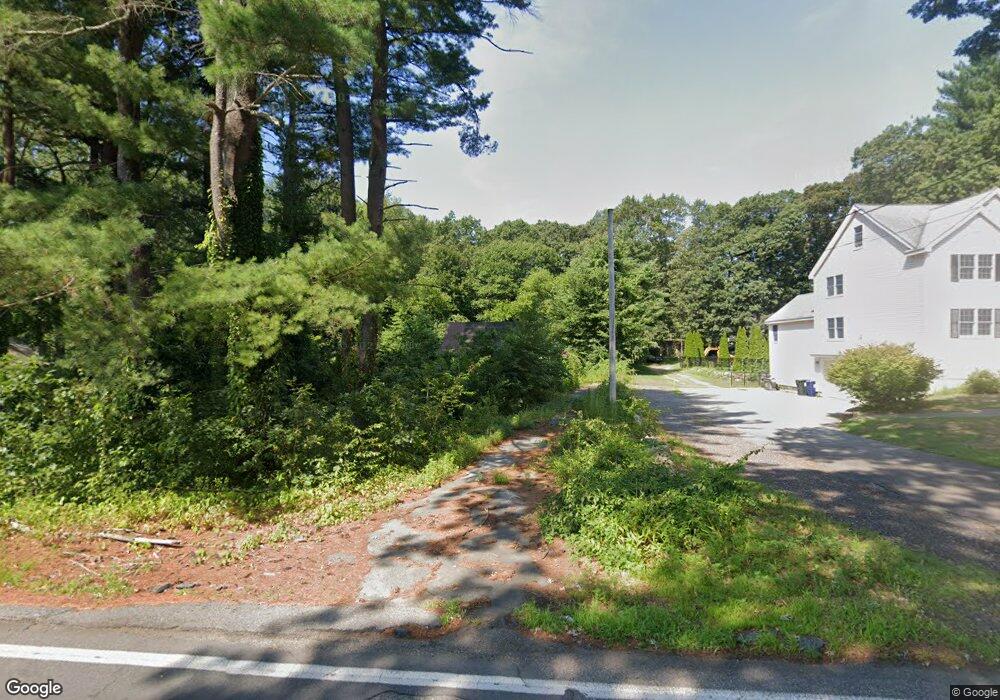
10 Forest St Wilmington, MA 01887
Estimated Value: $634,796 - $727,000
3
Beds
1
Bath
1,466
Sq Ft
$464/Sq Ft
Est. Value
About This Home
This home is located at 10 Forest St, Wilmington, MA 01887 and is currently estimated at $680,699, approximately $464 per square foot. 10 Forest St is a home located in Middlesex County with nearby schools including Wilmington Middle School, Wilmington High School, and Abundant Life Christian School and Childcare.
Ownership History
Date
Name
Owned For
Owner Type
Purchase Details
Closed on
Jun 7, 2021
Sold by
10 Forest Street Rt
Bought by
Guarino Jason M
Current Estimated Value
Purchase Details
Closed on
Oct 25, 2018
Sold by
Guarino 2011 Ret
Bought by
10 Forest Street Rt
Purchase Details
Closed on
May 25, 2011
Sold by
Guarino Carl and Guarino Mark
Bought by
Guarino 2011 Ret
Create a Home Valuation Report for This Property
The Home Valuation Report is an in-depth analysis detailing your home's value as well as a comparison with similar homes in the area
Purchase History
| Date | Buyer | Sale Price | Title Company |
|---|---|---|---|
| Guarino Jason M | -- | None Available | |
| 10 Forest Street Rt | -- | -- | |
| Guarino 2011 Ret | $26,000 | -- |
Source: Public Records
Tax History
| Year | Tax Paid | Tax Assessment Tax Assessment Total Assessment is a certain percentage of the fair market value that is determined by local assessors to be the total taxable value of land and additions on the property. | Land | Improvement |
|---|---|---|---|---|
| 2025 | $6,333 | $553,100 | $303,300 | $249,800 |
| 2024 | $6,276 | $549,100 | $303,300 | $245,800 |
| 2023 | $6,067 | $508,100 | $275,600 | $232,500 |
| 2022 | $5,587 | $428,800 | $229,700 | $199,100 |
| 2021 | $5,822 | $420,700 | $208,800 | $211,900 |
| 2020 | $5,750 | $423,400 | $208,800 | $214,600 |
| 2019 | $5,401 | $392,800 | $198,900 | $193,900 |
| 2018 | $5,398 | $374,600 | $189,400 | $185,200 |
| 2017 | $5,296 | $366,500 | $189,400 | $177,100 |
| 2016 | $4,734 | $323,600 | $180,400 | $143,200 |
| 2015 | $4,514 | $314,100 | $180,400 | $133,700 |
| 2014 | $4,248 | $298,300 | $171,700 | $126,600 |
Source: Public Records
Map
Nearby Homes
Your Personal Tour Guide
Ask me questions while you tour the home.