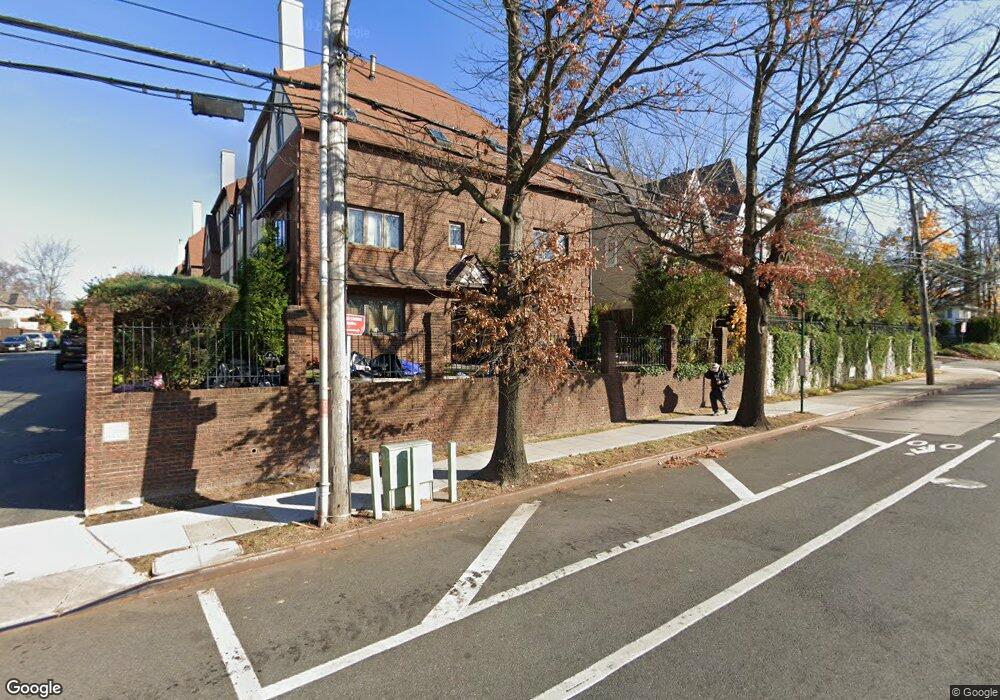
10 Fox Hunt Ct Staten Island, NY 10301
Sunnyside NeighborhoodEstimated Value: $687,000 - $816,672
3
Beds
4
Baths
2,000
Sq Ft
$377/Sq Ft
Est. Value
About This Home
This home is located at 10 Fox Hunt Ct, Staten Island, NY 10301 and is currently estimated at $753,168, approximately $376 per square foot. 10 Fox Hunt Ct is a home located in Richmond County with nearby schools including P.S. 35 The Clove Valley School, Intermediate School 27, and Curtis High School.
Ownership History
Date
Name
Owned For
Owner Type
Purchase Details
Closed on
Feb 25, 2009
Sold by
Stark Jennifer Esposito and Ruocchio Jennifer
Bought by
Pantoja Richard and Pantoja Maria
Current Estimated Value
Home Financials for this Owner
Home Financials are based on the most recent Mortgage that was taken out on this home.
Original Mortgage
$263,000
Outstanding Balance
$167,321
Interest Rate
5.14%
Mortgage Type
Purchase Money Mortgage
Estimated Equity
$585,847
Purchase Details
Closed on
Oct 8, 2003
Sold by
Wyne Jamshad and Wyne Andrea
Bought by
Stark Jennifer Esposito
Home Financials for this Owner
Home Financials are based on the most recent Mortgage that was taken out on this home.
Original Mortgage
$250,000
Interest Rate
5.8%
Mortgage Type
Purchase Money Mortgage
Purchase Details
Closed on
Aug 12, 1998
Sold by
Fairhurst Randall L and Fairhurst Sharon K
Bought by
Wyne Jamshad and Wyne Andrea
Create a Home Valuation Report for This Property
The Home Valuation Report is an in-depth analysis detailing your home's value as well as a comparison with similar homes in the area
Home Values in the Area
Average Home Value in this Area
Purchase History
| Date | Buyer | Sale Price | Title Company |
|---|---|---|---|
| Pantoja Richard | $353,000 | Commonwealth Land Title Insu | |
| Stark Jennifer Esposito | $350,000 | -- | |
| Wyne Jamshad | $165,000 | Fidelity National Title Ins |
Source: Public Records
Mortgage History
| Date | Status | Borrower | Loan Amount |
|---|---|---|---|
| Open | Pantoja Richard | $263,000 | |
| Previous Owner | Stark Jennifer Esposito | $250,000 |
Source: Public Records
Tax History Compared to Growth
Tax History
| Year | Tax Paid | Tax Assessment Tax Assessment Total Assessment is a certain percentage of the fair market value that is determined by local assessors to be the total taxable value of land and additions on the property. | Land | Improvement |
|---|---|---|---|---|
| 2025 | $6,056 | $48,960 | $9,714 | $39,246 |
| 2024 | $6,056 | $44,220 | $10,147 | $34,073 |
| 2023 | $6,124 | $30,154 | $9,164 | $20,990 |
| 2022 | $5,974 | $44,400 | $14,880 | $29,520 |
| 2021 | $5,941 | $39,420 | $14,880 | $24,540 |
| 2020 | $5,638 | $37,620 | $14,880 | $22,740 |
| 2019 | $5,257 | $32,700 | $14,880 | $17,820 |
| 2018 | $5,122 | $25,128 | $13,344 | $11,784 |
| 2017 | $5,084 | $24,938 | $12,993 | $11,945 |
| 2016 | $4,703 | $23,527 | $11,859 | $11,668 |
| 2015 | $4,019 | $22,196 | $14,621 | $7,575 |
| 2014 | $4,019 | $20,940 | $16,560 | $4,380 |
Source: Public Records
Map
Nearby Homes
- 144 Beverly Ave
- 1197 Clove Rd
- 1100 Clove Rd Unit 2N
- 1100 Clove Rd Unit 6D
- 1100 Clove Rd Unit G0
- 1100 Clove Rd Unit 7F
- 1100 Clove Rd Unit 6O
- 1100 Clove Rd Unit 2K
- 1100 Clove Rd Unit 3C
- 1100 Clove Rd Unit 2l
- 1100 Clove Rd Unit 60
- 1100 Clove Rd Unit 2 E
- 1100 Clove Rd Unit 6H
- 1100 Clove Rd Unit 3G
- 0 Waldron Ave
- 26 Fairway Ln
- 83 Glenwood Ave
- 64 Greenway Dr
- 40 Greenway Dr
- 150 Dudley Ave
- 12 Fox Hunt Ct
- 14 Fox Hunt Ct
- 16 Fox Hunt Ct
- 18 Fox Hunt Ct
- 1173 Clove Rd
- 148 Cheshire Place
- 146 Cheshire Place
- 144 Cheshire Place
- 26 Fox Hunt Ct
- 149 Beverly Ave
- 142 Cheshire Place
- 140 Cheshire Place
- 147 Beverly Ave
- 28 Fox Hunt Ct
- 138 Cheshire Place
- 30 Fox Hunt Ct
- 30 Fox Hunt Ct Unit Building
- 145 Beverly Ave
- 32 Fox Hunt Ct
- 141 Beverly Ave