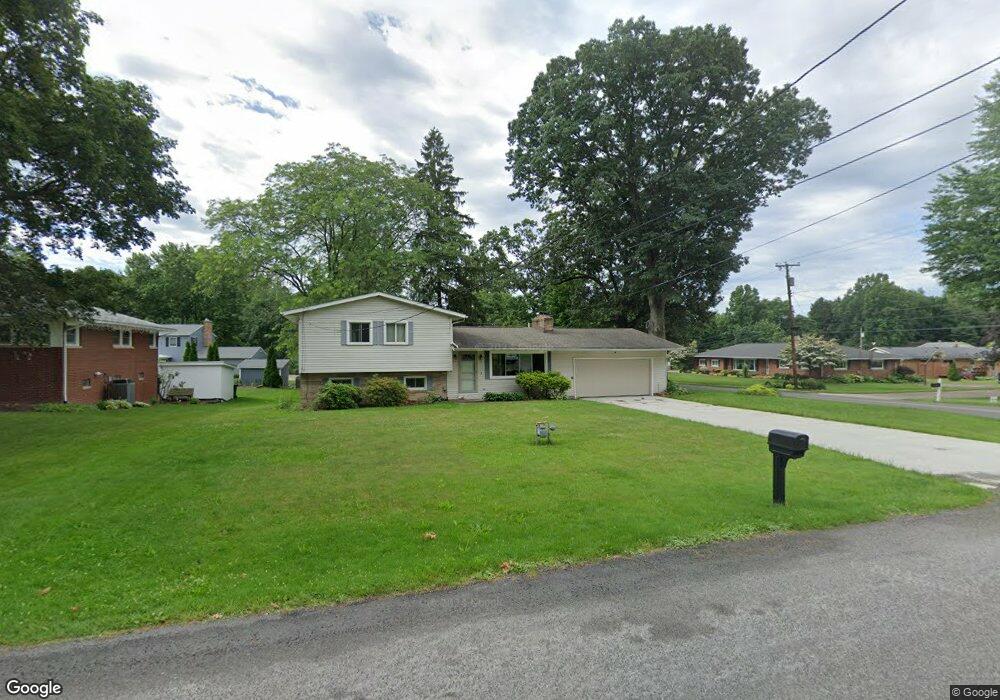
10 Franklin Dr Doylestown, OH 44230
Estimated Value: $229,000 - $268,000
3
Beds
2
Baths
1,136
Sq Ft
$216/Sq Ft
Est. Value
About This Home
This home is located at 10 Franklin Dr, Doylestown, OH 44230 and is currently estimated at $245,346, approximately $215 per square foot. 10 Franklin Dr is a home located in Wayne County with nearby schools including Hazel Harvey Elementary School, Chippewa Intermediate School, and Chippewa Jr./Sr. High School.
Ownership History
Date
Name
Owned For
Owner Type
Purchase Details
Closed on
Aug 1, 2003
Sold by
Federal Home Loan Mortgage Corporation
Bought by
Abn Amro Mortgage Group Inc
Current Estimated Value
Purchase Details
Closed on
May 2, 2003
Sold by
Abn Amro Mortgage Group Inc
Bought by
Livingston Matthew
Home Financials for this Owner
Home Financials are based on the most recent Mortgage that was taken out on this home.
Original Mortgage
$95,000
Interest Rate
5.97%
Mortgage Type
Unknown
Purchase Details
Closed on
May 24, 2002
Sold by
Shrf Diana Burton Pr
Bought by
Federal Home Loan Mortgage Corporation
Purchase Details
Closed on
Mar 24, 2000
Sold by
Adair Kenneth D
Bought by
Burton Diana and Burton Larry B
Home Financials for this Owner
Home Financials are based on the most recent Mortgage that was taken out on this home.
Original Mortgage
$117,800
Interest Rate
8.43%
Mortgage Type
New Conventional
Create a Home Valuation Report for This Property
The Home Valuation Report is an in-depth analysis detailing your home's value as well as a comparison with similar homes in the area
Home Values in the Area
Average Home Value in this Area
Purchase History
We collect this data history from publicly available records. To have your information removed, we recommend requesting removal directly through your county’s website.
| Date | Buyer | Sale Price | Title Company |
|---|---|---|---|
| Abn Amro Mortgage Group Inc | $106,000 | -- | |
| Livingston Matthew | $106,000 | -- | |
| Federal Home Loan Mortgage Corporation | $97,000 | -- | |
| Burton Diana | $124,000 | -- |
Source: Public Records
Mortgage History
We collect this data history from publicly available records. To have your information removed, we recommend requesting removal directly through your county’s website.
| Date | Status | Borrower | Loan Amount |
|---|---|---|---|
| Previous Owner | Livingston Matthew | $95,000 | |
| Previous Owner | Burton Diana | $117,800 |
Source: Public Records
Tax History
| Year | Tax Paid | Tax Assessment Tax Assessment Total Assessment is a certain percentage of the fair market value that is determined by local assessors to be the total taxable value of land and additions on the property. | Land | Improvement |
|---|---|---|---|---|
| 2025 | $2,429 | $66,450 | $17,080 | $49,370 |
| 2024 | $2,429 | $66,450 | $17,080 | $49,370 |
| 2023 | $2,440 | $66,450 | $17,080 | $49,370 |
| 2022 | $1,950 | $48,510 | $12,470 | $36,040 |
| 2021 | $1,963 | $48,510 | $12,470 | $36,040 |
| 2020 | $1,977 | $48,510 | $12,470 | $36,040 |
| 2019 | $1,832 | $43,300 | $11,970 | $31,330 |
| 2018 | $1,849 | $43,300 | $11,970 | $31,330 |
| 2017 | $1,784 | $43,300 | $11,970 | $31,330 |
| 2016 | $1,740 | $40,450 | $11,970 | $28,480 |
| 2015 | $1,733 | $40,450 | $11,970 | $28,480 |
| 2014 | $1,534 | $40,450 | $11,970 | $28,480 |
| 2013 | $1,752 | $44,940 | $15,940 | $29,000 |
Source: Public Records
Map
Nearby Homes
- 228 S Portage St
- 0 S Portage St
- 84 S Portage St
- 168 Huffman Ave
- 204 Circle Dr
- 174 Circle Dr
- 144 Church St
- 220 Catawba Path
- 680 Thorn Way
- 620 Thorn Way
- 0 Akron Rd Unit 5123781
- 15899 Mccallum Dr
- 669 Summit St
- 420 Gates St
- 500 W Clinton St
- 14959 Doylestown Rd
- 15500 Freedom Dr
- 243 Homan Dr
- V/L 1050 Melanie Ln
- 12045 Coal Bank Rd
Your Personal Tour Guide
Ask me questions while you tour the home.