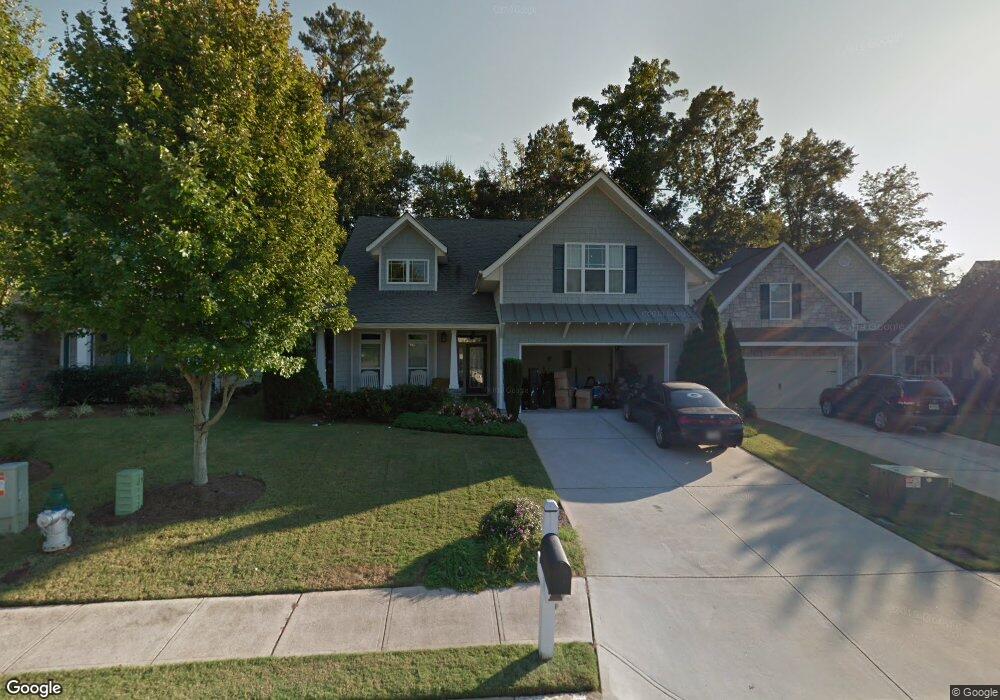
10 Gables Way Unit GC VIEW Newnan, GA 30265
Summergrove NeighborhoodEstimated Value: $441,923 - $608,000
3
Beds
3
Baths
2,740
Sq Ft
$179/Sq Ft
Est. Value
About This Home
This home is located at 10 Gables Way Unit GC VIEW, Newnan, GA 30265 and is currently estimated at $489,981, approximately $178 per square foot. 10 Gables Way Unit GC VIEW is a home located in Coweta County with nearby schools including Welch Elementary School, Lee Middle School, and East Coweta High School.
Ownership History
Date
Name
Owned For
Owner Type
Purchase Details
Closed on
Jul 24, 2015
Sold by
Hopkins Janet E
Bought by
Khutliwala Sonia
Current Estimated Value
Purchase Details
Closed on
Jun 15, 2012
Sold by
Armes Josephine E
Bought by
Hopkins Janet E
Home Financials for this Owner
Home Financials are based on the most recent Mortgage that was taken out on this home.
Original Mortgage
$230,743
Interest Rate
3.75%
Mortgage Type
FHA
Purchase Details
Closed on
Aug 26, 2004
Sold by
Chadwick Homes Inc
Bought by
Armes Josephine E
Home Financials for this Owner
Home Financials are based on the most recent Mortgage that was taken out on this home.
Original Mortgage
$180,000
Interest Rate
6.01%
Mortgage Type
New Conventional
Purchase Details
Closed on
Dec 30, 2002
Sold by
Peachtree City Holdings Llc
Bought by
Chadwick Homes Inc
Purchase Details
Closed on
Jan 25, 2000
Bought by
Peachtree City Holdings Llc
Create a Home Valuation Report for This Property
The Home Valuation Report is an in-depth analysis detailing your home's value as well as a comparison with similar homes in the area
Home Values in the Area
Average Home Value in this Area
Purchase History
| Date | Buyer | Sale Price | Title Company |
|---|---|---|---|
| Khutliwala Sonia | $295,000 | -- | |
| Hopkins Janet E | $235,000 | -- | |
| Armes Josephine E | $272,100 | -- | |
| Chadwick Homes Inc | $574,000 | -- | |
| Peachtree City Holdings Llc | -- | -- |
Source: Public Records
Mortgage History
| Date | Status | Borrower | Loan Amount |
|---|---|---|---|
| Previous Owner | Hopkins Janet E | $230,743 | |
| Previous Owner | Armes Josephine E | $180,000 |
Source: Public Records
Tax History Compared to Growth
Tax History
| Year | Tax Paid | Tax Assessment Tax Assessment Total Assessment is a certain percentage of the fair market value that is determined by local assessors to be the total taxable value of land and additions on the property. | Land | Improvement |
|---|---|---|---|---|
| 2025 | $4,301 | $179,051 | $36,000 | $143,051 |
| 2024 | $3,948 | $172,794 | $32,000 | $140,794 |
| 2023 | $3,948 | $174,107 | $32,000 | $142,107 |
| 2022 | $3,142 | $132,637 | $32,000 | $100,637 |
| 2021 | $3,160 | $121,142 | $32,000 | $89,142 |
| 2020 | $3,229 | $121,142 | $32,000 | $89,142 |
| 2019 | $3,198 | $110,194 | $20,000 | $90,194 |
| 2018 | $3,217 | $110,194 | $20,000 | $90,194 |
| 2017 | $3,316 | $110,194 | $20,000 | $90,194 |
| 2016 | $3,278 | $108,877 | $20,000 | $88,877 |
| 2015 | $2,898 | $96,077 | $20,000 | $76,077 |
| 2014 | $3,136 | $96,077 | $20,000 | $76,077 |
Source: Public Records
Map
Nearby Homes
- 64 Gables Way
- 43 Beacon Crest
- 100 Arbor Way
- 69 Arbor Way
- 15 Downing Ct
- 30 Oak Shores Dr
- 161 Lake Shore Dr
- 15 Oak Shores Dr
- 3 Briar Grove
- 39 Rollingbrook Vista
- 185 Lake Shore Dr
- 41 Briar Grove
- 21 Oak Park Square
- 425 Lake Forest Dr
- 111 Portico Place
- 147 Lake Cove Approach
- 41 Corbel Way
- 415 Vanderbilt Pkwy
- 10 Fenway Ct
- 233 Horizon Hill
- 10 Gables Way
- 10 Gables Way Unit 19
- 6 Gables Way
- 14 Gables Way
- 18 Gables Way
- 2 Gables Way
- 2 Gables Way Unit 21
- 0 Arbor Way Unit 26H2 2989616
- 0 Arbor Way
- 22 Gables Way
- 11 Gables Way
- 7 Gables Way
- 3 Gables Way
- 26 Gables Way
- 4 Arbor Way
- 30 Gables Way
- 10 Arbor Way
- 24 Arbor Way
- 24H2 Arbor Springs Pkwy
- 75 Gables Way Unit 29