10 Ganung Dr Ossining, NY 10562
North Ossining NeighborhoodEstimated Value: $718,000 - $777,388
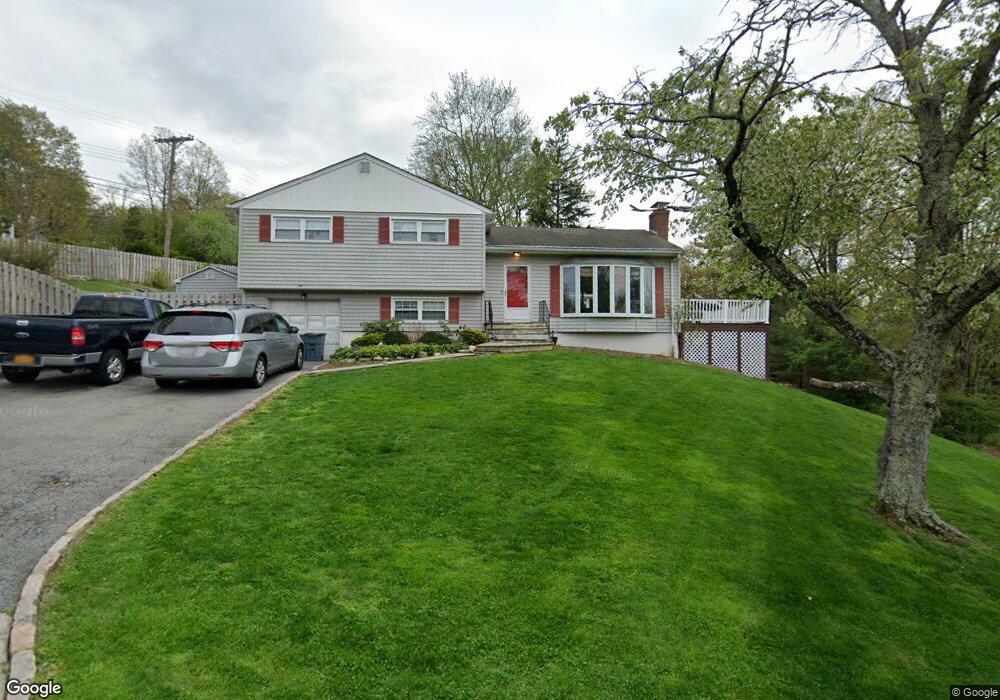
About This Home
This home is located at 10 Ganung Dr, Ossining, NY 10562 and is currently estimated at $752,597, approximately $441 per square foot. 10 Ganung Dr is a home located in Westchester County with nearby schools including Park School, Roosevelt Elementary School, and Brookside Elementary School.
Ownership History
We collect this data history from publicly available records. To have your information removed, we recommend requesting removal directly through your county’s website.
Purchase Details
Home Financials for this Owner
Home Financials are based on the most recent Mortgage that was taken out on this home.Home Values in the Area
Average Home Value in this Area
Purchase History
We collect this data history from publicly available records. To have your information removed, we recommend requesting removal directly through your county’s website.
| Date | Buyer | Sale Price | Title Company |
|---|---|---|---|
| $375,000 | Thoroughbred Title Services |
Mortgage History
We collect this data history from publicly available records. To have your information removed, we recommend requesting removal directly through your county’s website.
| Date | Status | Borrower | Loan Amount |
|---|---|---|---|
| Open | $6,324 | ||
| Open | $368,207 |
Tax History
We collect this data history from publicly available records. To have your information removed, we recommend requesting removal directly through your county’s website.
| Year | Tax Paid | Tax Assessment Tax Assessment Total Assessment is a certain percentage of the fair market value that is determined by local assessors to be the total taxable value of land and additions on the property. | Land | Improvement |
|---|---|---|---|---|
| 2025 | -- | $610,800 | $299,500 | $311,300 |
| 2024 | $14,809 | $549,900 | $187,500 | $362,400 |
| 2023 | $14,048 | $514,300 | $187,500 | $326,800 |
| 2022 | $13,655 | $460,000 | $187,500 | $272,500 |
| 2021 | $13,734 | $418,200 | $187,500 | $230,700 |
| 2020 | $12,883 | $418,200 | $187,500 | $230,700 |
| 2019 | $12,684 | $385,100 | $187,500 | $197,600 |
| 2018 | $12,630 | $385,100 | $187,500 | $197,600 |
| 2017 | $7,457 | $381,400 | $187,500 | $193,900 |
| 2016 | $135,426 | $370,300 | $187,500 | $182,800 |
| 2015 | $9,121 | $20,700 | $6,500 | $14,200 |
| 2014 | $9,121 | $19,600 | $6,500 | $13,100 |
| 2013 | $9,121 | $19,600 | $6,500 | $13,100 |
Map
- 27 Ryder Rd
- 0 Chappaqua Rd
- 23 Gates Ave
- 14 Wyche Way
- 116 Burns Place
- 10 Susquehanna Rd
- 22 Oakbrook Rd
- 83 Somerstown Rd
- 53 Pleasantville Rd
- 31 Burns Place
- 94 Somerstown Rd
- 94 Somerstown Rd
- 94 Somerstown Rd
- 97 Morningside Dr
- 225 Schrade Rd Unit 1E
- 223 Schrade Rd Unit 2C
- 15 Marshall Place
- 110 Morningside Dr
- 517A Old Chappaqua Rd
- 352 N State Rd Unit 1H
Ask me questions while you tour the home.