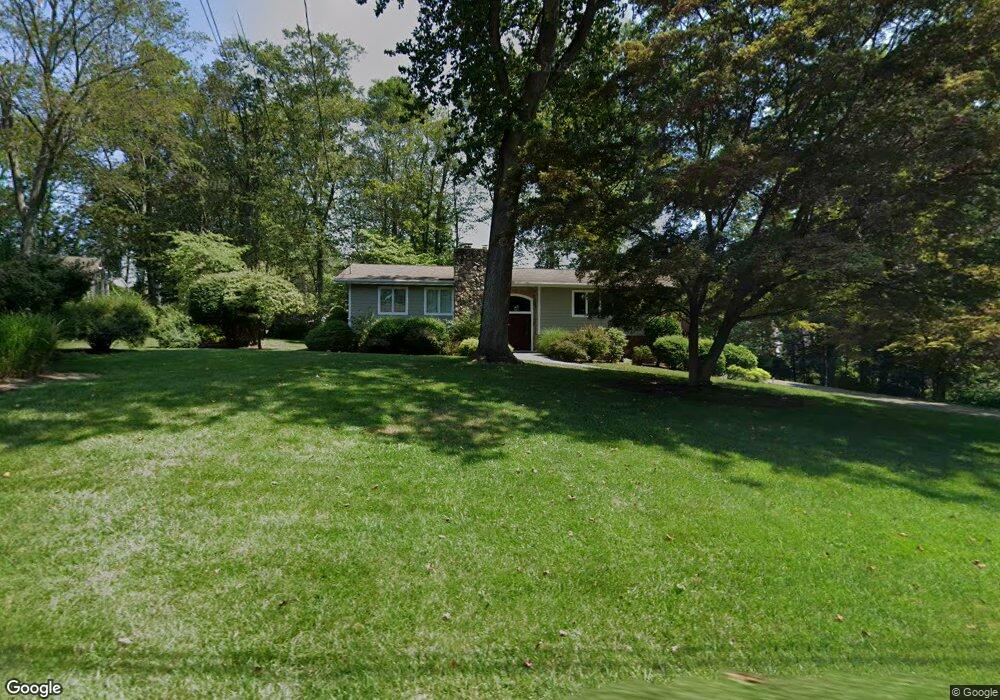
10 Gary Ct Woodcliff Lake, NJ 07677
Estimated Value: $928,936 - $1,089,000
--
Bed
--
Bath
1,798
Sq Ft
$557/Sq Ft
Est. Value
About This Home
This home is located at 10 Gary Ct, Woodcliff Lake, NJ 07677 and is currently estimated at $1,001,734, approximately $557 per square foot. 10 Gary Ct is a home located in Bergen County with nearby schools including Dorchester Elementary School, Woodcliff Middle School, and Pascack Hills High School.
Ownership History
Date
Name
Owned For
Owner Type
Purchase Details
Closed on
Aug 21, 2000
Sold by
Wechsler Bernard
Bought by
Christophel John J and Christophel Ingrid D
Current Estimated Value
Home Financials for this Owner
Home Financials are based on the most recent Mortgage that was taken out on this home.
Original Mortgage
$367,920
Outstanding Balance
$132,462
Interest Rate
8.12%
Mortgage Type
Stand Alone First
Estimated Equity
$869,272
Create a Home Valuation Report for This Property
The Home Valuation Report is an in-depth analysis detailing your home's value as well as a comparison with similar homes in the area
Home Values in the Area
Average Home Value in this Area
Purchase History
| Date | Buyer | Sale Price | Title Company |
|---|---|---|---|
| Christophel John J | $459,900 | -- |
Source: Public Records
Mortgage History
| Date | Status | Borrower | Loan Amount |
|---|---|---|---|
| Open | Christophel John J | $367,920 |
Source: Public Records
Tax History Compared to Growth
Tax History
| Year | Tax Paid | Tax Assessment Tax Assessment Total Assessment is a certain percentage of the fair market value that is determined by local assessors to be the total taxable value of land and additions on the property. | Land | Improvement |
|---|---|---|---|---|
| 2025 | $15,043 | $711,400 | $405,800 | $305,600 |
| 2024 | $14,601 | $695,800 | $395,800 | $300,000 |
| 2023 | $13,566 | $674,400 | $388,300 | $286,100 |
| 2022 | $13,566 | $620,000 | $345,100 | $274,900 |
| 2021 | $12,658 | $578,000 | $310,100 | $267,900 |
| 2020 | $12,215 | $581,400 | $312,600 | $268,800 |
| 2019 | $11,713 | $560,700 | $308,100 | $252,600 |
| 2018 | $11,520 | $555,700 | $304,100 | $251,600 |
| 2017 | $11,435 | $546,600 | $300,100 | $246,500 |
| 2016 | $11,571 | $539,700 | $295,100 | $244,600 |
| 2015 | $11,260 | $530,400 | $290,100 | $240,300 |
| 2014 | $11,328 | $512,800 | $277,500 | $235,300 |
Source: Public Records
Map
Nearby Homes