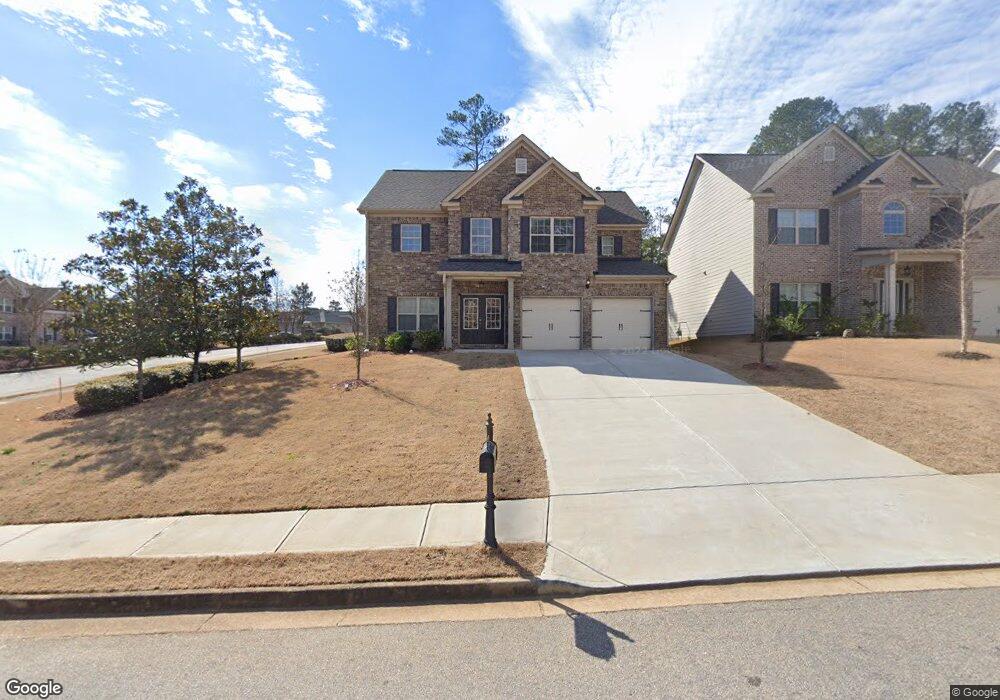
10 Glen Abbey Cir Unit 35 Fairburn, GA 30213
Estimated Value: $331,000 - $369,000
4
Beds
3
Baths
2,452
Sq Ft
$143/Sq Ft
Est. Value
About This Home
This home is located at 10 Glen Abbey Cir Unit 35, Fairburn, GA 30213 and is currently estimated at $350,528, approximately $142 per square foot. 10 Glen Abbey Cir Unit 35 is a home located in Fulton County with nearby schools including E. C. West Elementary School, Bear Creek Middle School, and Creekside High School.
Ownership History
Date
Name
Owned For
Owner Type
Purchase Details
Closed on
Aug 13, 2020
Sold by
Resicap Cv Borrower Llc
Bought by
Mnf Iii Acquisitions Llc
Current Estimated Value
Purchase Details
Closed on
Jul 24, 2019
Sold by
Resicap Fund 1 Llc
Bought by
Resicap Cv Borrower Llc
Purchase Details
Closed on
May 15, 2019
Sold by
Silverstone Residential Llc
Bought by
Resicap Fund 1 Llc
Purchase Details
Closed on
Jul 26, 2018
Sold by
Ireland Aweda D E
Bought by
Silverstone Residential Llc
Home Financials for this Owner
Home Financials are based on the most recent Mortgage that was taken out on this home.
Original Mortgage
$112,850
Interest Rate
4.5%
Mortgage Type
Mortgage Modification
Purchase Details
Closed on
Apr 11, 2015
Sold by
Johnson Robert D
Bought by
Ireland Aweda D E
Purchase Details
Closed on
Aug 22, 2012
Sold by
Milam Assest Llc
Bought by
Johnson Robert D
Purchase Details
Closed on
Sep 29, 2011
Sold by
Southeastern Real Estate D
Bought by
Milam Assest
Create a Home Valuation Report for This Property
The Home Valuation Report is an in-depth analysis detailing your home's value as well as a comparison with similar homes in the area
Home Values in the Area
Average Home Value in this Area
Purchase History
| Date | Buyer | Sale Price | Title Company |
|---|---|---|---|
| Mnf Iii Acquisitions Llc | $1,692,378 | -- | |
| Mnf Iii Acquisitions Llc | -- | -- | |
| Resicap Cv Borrower Llc | -- | -- | |
| Resicap Fund 1 Llc | $201,440 | -- | |
| Silverstone Residential Llc | $162,000 | -- | |
| Ireland Aweda D E | $66,000 | -- | |
| Johnson Robert D | $18,000 | -- | |
| Milam Assest | $10,560 | -- |
Source: Public Records
Mortgage History
| Date | Status | Borrower | Loan Amount |
|---|---|---|---|
| Previous Owner | Silverstone Residential Llc | $112,850 |
Source: Public Records
Tax History Compared to Growth
Tax History
| Year | Tax Paid | Tax Assessment Tax Assessment Total Assessment is a certain percentage of the fair market value that is determined by local assessors to be the total taxable value of land and additions on the property. | Land | Improvement |
|---|---|---|---|---|
| 2025 | $1,291 | $135,080 | $30,840 | $104,240 |
| 2023 | $3,533 | $125,160 | $43,640 | $81,520 |
| 2022 | $2,885 | $109,640 | $28,160 | $81,480 |
| 2021 | $2,727 | $100,520 | $22,520 | $78,000 |
| 2020 | $2,239 | $80,560 | $17,320 | $63,240 |
| 2019 | $501 | $52,440 | $18,680 | $33,760 |
| 2018 | $203 | $18,240 | $18,240 | $0 |
| 2017 | $210 | $7,200 | $7,200 | $0 |
| 2016 | $179 | $7,200 | $7,200 | $0 |
| 2015 | $505 | $7,200 | $7,200 | $0 |
| 2014 | $31 | $17,240 | $17,240 | $0 |
Source: Public Records
Map
Nearby Homes
- 6945 John Rivers Rd
- 7200 Mahogany Dr
- 700 Buckingham Terrace
- 925 Buckingham Cove
- 5120 Blackheath Way
- 6990 Oak Leaf Dr
- 6835 Tell Rd
- 7215 Cane Leaf Dr
- 338 Champions Dr
- 7055 Rivertown Rd Unit 301
- 100 Grande Bishop Dr
- 75 Fanleaf Dr
- 7000 Bishop Rd
- 210 Fanleaf Dr
- 799 Grande Bishop Dr Unit 27
- 782 Grande Bishop Dr Unit 65
- The Baylor II 3-ME Plan at Bishop Meadows
- Ramsey II 3-M Plan at Bishop Meadows
- The Florence I 3-ME Plan at Bishop Meadows
- The Cahaba 3-M Plan at Bishop Meadows
- 10 Glen Abbey Cir
- 10 Glen Abbey Cir
- 10 Glen Abbey Cir Unit 35
- 10 Glen Abbey Cir
- 20 Glen Abbey Cir
- 30 Glen Abbey Cir
- 40 Glen Abbey Cir Unit 4
- 0 Glen Abbey Cir Unit 12 7037648
- 0 Glen Abbey Cir Unit 13 7037628
- 0 Glen Abbey Cir Unit 11 7037624
- 0 Glen Abbey Cir Unit 10 7037603
- 0 Glen Abbey Cir Unit 9 7037595
- 0 Glen Abbey Cir Unit 8 7037585
- 0 Glen Abbey Cir Unit 7 7037545
- 0 Glen Abbey Cir Unit 5 7037505
- 0 Glen Abbey Cir Unit 6 7037513
- 0 Glen Abbey Cir Unit 4 7037353
- 0 Glen Abbey Cir Unit 12 7215030
- 0 Glen Abbey Cir Unit 13 7215026
- 0 Glen Abbey Cir Unit 11 7215025