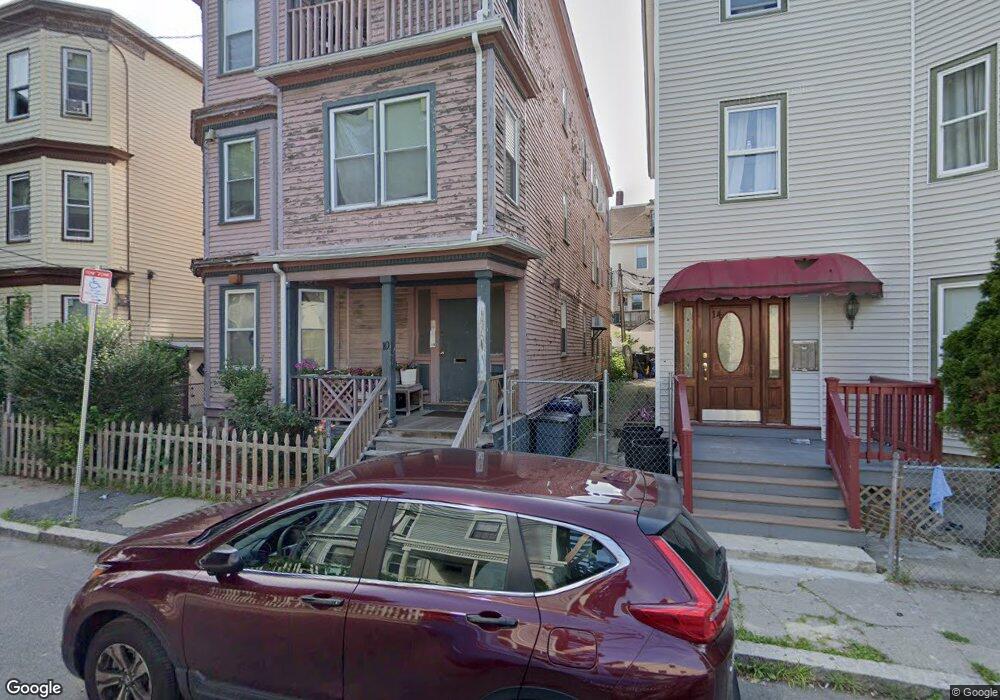
10 Glenburne St Dorchester, MA 02121
Sav-Mor NeighborhoodEstimated Value: $1,076,000 - $1,272,000
8
Beds
3
Baths
4,410
Sq Ft
$261/Sq Ft
Est. Value
About This Home
This home is located at 10 Glenburne St, Dorchester, MA 02121 and is currently estimated at $1,151,667, approximately $261 per square foot. 10 Glenburne St is a home located in Suffolk County with nearby schools including Bridge Boston Charter School and Mother Caroline Academy & Education Center.
Ownership History
Date
Name
Owned For
Owner Type
Purchase Details
Closed on
Jun 13, 2000
Sold by
Nguyen Hoa
Bought by
Henshaw-Basey Vanessa
Current Estimated Value
Purchase Details
Closed on
Dec 14, 1994
Sold by
Johnson John D and Johnson Ruth
Bought by
Johnson Steven D and Johnson Tracey P
Create a Home Valuation Report for This Property
The Home Valuation Report is an in-depth analysis detailing your home's value as well as a comparison with similar homes in the area
Home Values in the Area
Average Home Value in this Area
Purchase History
| Date | Buyer | Sale Price | Title Company |
|---|---|---|---|
| Henshaw-Basey Vanessa | $26,500 | -- | |
| Johnson Steven D | $144,000 | -- |
Source: Public Records
Mortgage History
| Date | Status | Borrower | Loan Amount |
|---|---|---|---|
| Open | Johnson Steven D | $364,000 | |
| Closed | Johnson Steven D | $75,000 |
Source: Public Records
Tax History Compared to Growth
Tax History
| Year | Tax Paid | Tax Assessment Tax Assessment Total Assessment is a certain percentage of the fair market value that is determined by local assessors to be the total taxable value of land and additions on the property. | Land | Improvement |
|---|---|---|---|---|
| 2025 | $9,828 | $848,700 | $183,400 | $665,300 |
| 2024 | $9,789 | $898,100 | $158,200 | $739,900 |
| 2023 | $8,223 | $765,600 | $150,700 | $614,900 |
| 2022 | $7,928 | $728,700 | $143,400 | $585,300 |
| 2021 | $7,406 | $694,100 | $136,600 | $557,500 |
| 2020 | $5,805 | $549,700 | $124,200 | $425,500 |
| 2019 | $5,172 | $490,700 | $89,200 | $401,500 |
| 2018 | $4,762 | $454,400 | $89,200 | $365,200 |
| 2017 | $4,812 | $454,400 | $89,200 | $365,200 |
| 2016 | $4,346 | $395,100 | $89,200 | $305,900 |
| 2015 | $3,996 | $330,000 | $79,500 | $250,500 |
| 2014 | $3,878 | $308,300 | $79,500 | $228,800 |
Source: Public Records
Map
Nearby Homes
- 5 Glenburne St
- 8 Weldon St
- 12 Weldon St
- 476 Warren St
- 495 Warren St
- 4 Wyoming St Unit 2
- 7 Waumbeck St Unit 3
- 2 Otisfield St
- 108 Maywood St Unit 2
- 28 Wabon St
- 340 Blue Hill Ave
- 352 Blue Hill Ave Unit 8
- 99 Harrishof St
- 31 Dewey St
- 151 Townsend St
- 8 Adrian St
- 35 Dewey St Unit 35
- 62 Clifford St Unit A
- 52 Intervale St
- 40 Devon St Unit 3
- 14 Glenburne St
- 6 Glenburne St
- 442 Warren St
- 442 Warren St Unit 2
- 442 Warren St Unit 3
- 442 Warren St Unit 1
- 440 Warren St Unit 3
- 440 Warren St Unit 2
- 440 Warren St Unit 1
- 444 Warren St
- 9 Glenburne St Unit 2
- 10 Holborn St Unit 1
- 10 Holborn St
- 10 Holborn St Unit 2
- 10 Holborn St Unit 3
- 56 Quincy St
- 5 Quincy Place Unit 2
- 5 Quincy Place Unit 3
- 5 Quincy Place Unit 1
- 6 Quincy Place