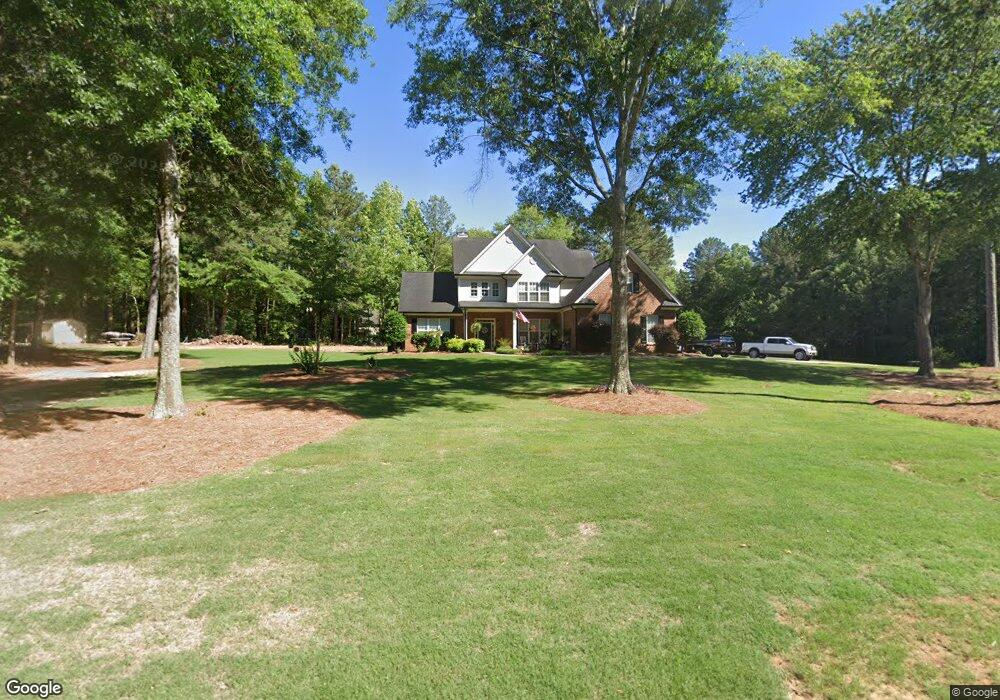
10 Glenda Ct Sharpsburg, GA 30277
Estimated Value: $431,817 - $560,000
3
Beds
3
Baths
2,743
Sq Ft
$181/Sq Ft
Est. Value
About This Home
This home is located at 10 Glenda Ct, Sharpsburg, GA 30277 and is currently estimated at $497,454, approximately $181 per square foot. 10 Glenda Ct is a home located in Coweta County with nearby schools including Willis Road Elementary School, Lee Middle School, and East Coweta High School.
Ownership History
Date
Name
Owned For
Owner Type
Purchase Details
Closed on
Apr 21, 2007
Sold by
Smelcer Christy R
Bought by
Smelcer Steven R
Current Estimated Value
Purchase Details
Closed on
Jan 30, 2004
Sold by
Martin Barry E and Mar Danette J
Bought by
Martin Barry E
Purchase Details
Closed on
Nov 28, 2001
Sold by
Homescapes Inc
Bought by
Martin Harry E and Martin Danette J
Home Financials for this Owner
Home Financials are based on the most recent Mortgage that was taken out on this home.
Original Mortgage
$205,200
Interest Rate
6.59%
Mortgage Type
New Conventional
Purchase Details
Closed on
Jan 12, 2001
Sold by
Sharpsburg Trio Inc
Bought by
Homescapes Inc
Purchase Details
Closed on
May 20, 2000
Sold by
Sharpsburg Trio Inc
Bought by
Sharpsburg Trio Inc
Purchase Details
Closed on
May 20, 1999
Bought by
Sharpsburg Trio Inc
Create a Home Valuation Report for This Property
The Home Valuation Report is an in-depth analysis detailing your home's value as well as a comparison with similar homes in the area
Home Values in the Area
Average Home Value in this Area
Purchase History
| Date | Buyer | Sale Price | Title Company |
|---|---|---|---|
| Smelcer Steven R | -- | -- | |
| Martin Barry E | -- | -- | |
| Martin Harry E | $216,000 | -- | |
| Homescapes Inc | $73,500 | -- | |
| Sharpsburg Trio Inc | -- | -- | |
| Sharpsburg Trio Inc | $364,000 | -- |
Source: Public Records
Mortgage History
| Date | Status | Borrower | Loan Amount |
|---|---|---|---|
| Previous Owner | Martin Harry E | $205,200 |
Source: Public Records
Tax History Compared to Growth
Tax History
| Year | Tax Paid | Tax Assessment Tax Assessment Total Assessment is a certain percentage of the fair market value that is determined by local assessors to be the total taxable value of land and additions on the property. | Land | Improvement |
|---|---|---|---|---|
| 2025 | $3,837 | $168,000 | $24,000 | $144,000 |
| 2024 | $3,661 | $160,255 | $24,000 | $136,255 |
| 2023 | $3,661 | $152,029 | $24,000 | $128,029 |
| 2022 | $3,155 | $130,840 | $16,000 | $114,840 |
| 2021 | $3,081 | $119,898 | $16,000 | $103,898 |
| 2020 | $3,100 | $119,898 | $16,000 | $103,898 |
| 2019 | $2,926 | $103,134 | $15,000 | $88,134 |
| 2018 | $2,932 | $103,134 | $15,000 | $88,134 |
| 2017 | $2,794 | $98,469 | $15,000 | $83,469 |
| 2016 | $2,763 | $98,469 | $15,000 | $83,469 |
| 2015 | $2,246 | $81,811 | $15,000 | $66,811 |
| 2014 | $2,231 | $81,811 | $15,000 | $66,811 |
Source: Public Records
Map
Nearby Homes
- 40 Long Branch Trail
- 50 Kay Ct
- 73 Oakhurst Trail
- Grayson with Basement Plan at Twelve Parks - Ranch
- Denton with Basement Plan at Twelve Parks - Ranch
- Sullivan Plan at Twelve Parks - Ranch
- Denton Plan at Twelve Parks - Ranch
- Grayson Plan at Twelve Parks - Ranch
- 24 Tallulah Trail
- 8 Chiefs Trail
- 127 Circle H Rd
- 7483 Highway 54
- Briarwood Plan at Twelve Parks 55+
- Sullivan Plan at Twelve Parks 55+
- 4 Unicoi Trail
- 12 Unicoi Trail
- Crestwood Plan at Twelve Parks 55+
- 98 Keown Loop
- Brunswick Plan at Twelve Parks 55+
- 28 Fawn Ct
- 20 Glenda Ct
- 20 Shelley Ln
- 25 Shelley Ln Unit 2
- 25 Shelley Ln
- 15 Shelley Ln
- 25 Glenda Ct
- 35 Shelley Ln
- 1470 Reese Rd
- 25 Kay Ct
- 30 Glenda Ct
- 40 Shelley Ln
- 35 Glenda Ct
- 1452 Reese Rd
- 30 Kay Ct
- 45 Shelley Ln
- 29 Long Branch Trail Unit 26 1B
- 21 Long Branch Trail Unit 24
- 25 Long Branch Trail
- 17 Long Branch Trail Unit 23
- 13 Long Branch Trail Unit LOT 22 1B