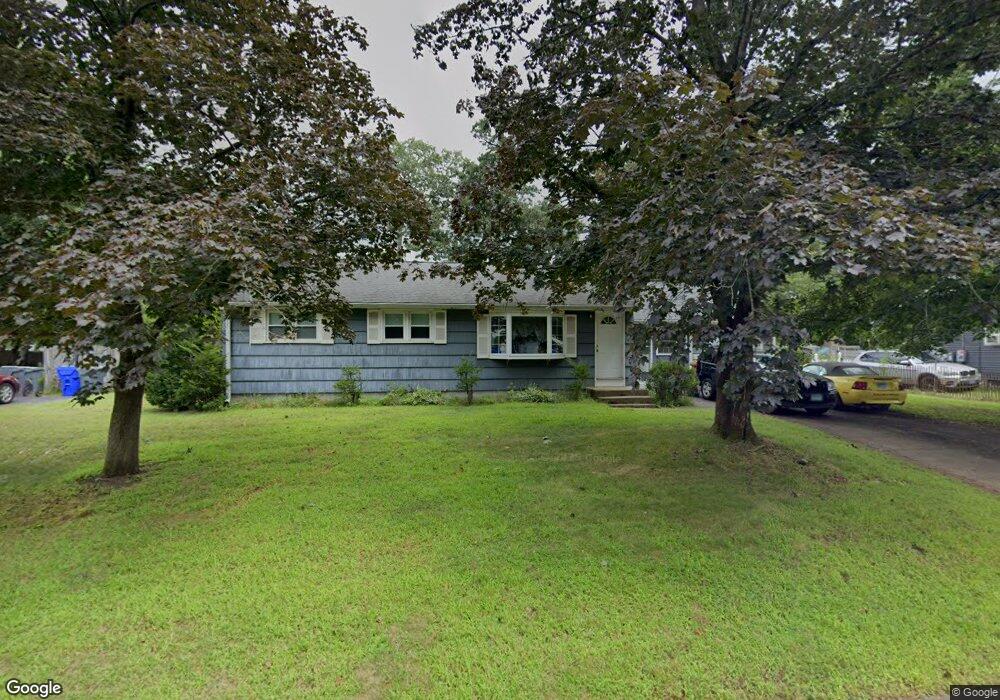
10 Glendale Rd Enfield, CT 06082
Estimated Value: $255,000 - $334,000
3
Beds
1
Bath
1,000
Sq Ft
$303/Sq Ft
Est. Value
About This Home
This home is located at 10 Glendale Rd, Enfield, CT 06082 and is currently estimated at $302,627, approximately $302 per square foot. 10 Glendale Rd is a home located in Hartford County with nearby schools including Eli Whitney Elementary School, Hazardville Memorial Elementary School, and Enfield High School.
Ownership History
Date
Name
Owned For
Owner Type
Purchase Details
Closed on
Mar 2, 1998
Sold by
Marine Midland Bank
Bought by
Smith James
Current Estimated Value
Purchase Details
Closed on
Nov 30, 1988
Sold by
Forsman Arnold
Bought by
Provost John
Home Financials for this Owner
Home Financials are based on the most recent Mortgage that was taken out on this home.
Original Mortgage
$129,100
Interest Rate
10.19%
Create a Home Valuation Report for This Property
The Home Valuation Report is an in-depth analysis detailing your home's value as well as a comparison with similar homes in the area
Home Values in the Area
Average Home Value in this Area
Purchase History
We collect this data history from publicly available records. To have your information removed, we recommend requesting removal directly through your county’s website.
| Date | Buyer | Sale Price | Title Company |
|---|---|---|---|
| Smith James | $80,150 | -- | |
| Provost John | $135,900 | -- |
Source: Public Records
Mortgage History
We collect this data history from publicly available records. To have your information removed, we recommend requesting removal directly through your county’s website.
| Date | Status | Borrower | Loan Amount |
|---|---|---|---|
| Previous Owner | Provost John | $129,100 |
Source: Public Records
Tax History
| Year | Tax Paid | Tax Assessment Tax Assessment Total Assessment is a certain percentage of the fair market value that is determined by local assessors to be the total taxable value of land and additions on the property. | Land | Improvement |
|---|---|---|---|---|
| 2025 | $5,165 | $147,600 | $56,400 | $91,200 |
| 2024 | $5,026 | $147,600 | $56,400 | $91,200 |
| 2023 | $4,989 | $147,600 | $56,400 | $91,200 |
| 2022 | $4,530 | $147,600 | $56,400 | $91,200 |
| 2021 | $4,270 | $113,770 | $46,660 | $67,110 |
| 2020 | $4,270 | $113,770 | $46,660 | $67,110 |
| 2019 | $4,281 | $113,770 | $46,660 | $67,110 |
| 2018 | $4,209 | $113,770 | $46,660 | $67,110 |
| 2017 | $3,974 | $113,770 | $46,660 | $67,110 |
| 2016 | $3,960 | $115,430 | $47,880 | $67,550 |
| 2015 | $3,837 | $115,430 | $47,880 | $67,550 |
| 2014 | $3,738 | $115,430 | $47,880 | $67,550 |
Source: Public Records
Map
Nearby Homes
Your Personal Tour Guide
Ask me questions while you tour the home.