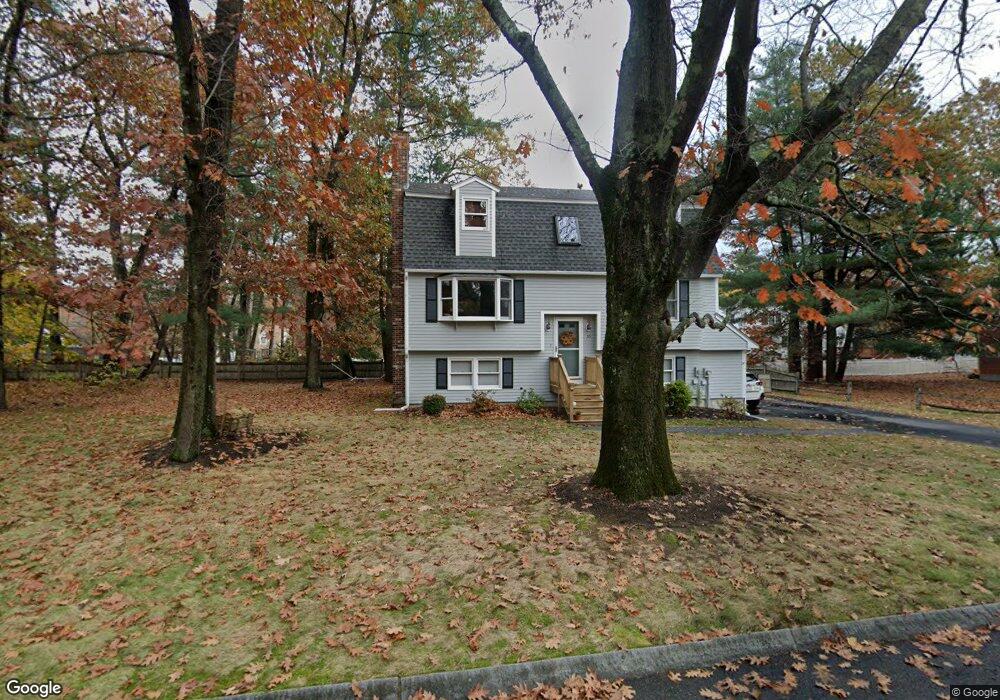
10 Glenn Rd Merrimac, MA 01860
Estimated Value: $667,213 - $818,000
4
Beds
2
Baths
1,996
Sq Ft
$364/Sq Ft
Est. Value
About This Home
This home is located at 10 Glenn Rd, Merrimac, MA 01860 and is currently estimated at $725,803, approximately $363 per square foot. 10 Glenn Rd is a home located in Essex County with nearby schools including Pentucket Regional High School.
Ownership History
Date
Name
Owned For
Owner Type
Purchase Details
Closed on
May 24, 2024
Sold by
Recine Larry J and Recine Lisa M
Bought by
Zjr Rt and Recine
Current Estimated Value
Purchase Details
Closed on
Feb 3, 1993
Sold by
Walter J Pondelli Inc
Bought by
Recine Larry J and Recine Lisa M
Create a Home Valuation Report for This Property
The Home Valuation Report is an in-depth analysis detailing your home's value as well as a comparison with similar homes in the area
Home Values in the Area
Average Home Value in this Area
Purchase History
| Date | Buyer | Sale Price | Title Company |
|---|---|---|---|
| Zjr Rt | -- | None Available | |
| Zjr Rt | -- | None Available | |
| Recine Larry J | $128,850 | -- | |
| Recine Larry J | $128,850 | -- |
Source: Public Records
Mortgage History
| Date | Status | Borrower | Loan Amount |
|---|---|---|---|
| Previous Owner | Recine Larry J | $175,500 | |
| Previous Owner | Recine Larry J | $176,500 | |
| Previous Owner | Recine Larry J | $175,000 |
Source: Public Records
Tax History
| Year | Tax Paid | Tax Assessment Tax Assessment Total Assessment is a certain percentage of the fair market value that is determined by local assessors to be the total taxable value of land and additions on the property. | Land | Improvement |
|---|---|---|---|---|
| 2025 | $7,346 | $554,400 | $299,600 | $254,800 |
| 2024 | $7,186 | $532,300 | $283,000 | $249,300 |
| 2023 | $6,933 | $469,400 | $239,700 | $229,700 |
| 2022 | $6,348 | $388,500 | $193,100 | $195,400 |
| 2021 | $5,752 | $352,900 | $176,400 | $176,500 |
| 2020 | $5,251 | $352,900 | $176,400 | $176,500 |
| 2019 | $5,062 | $320,200 | $153,100 | $167,100 |
| 2018 | $4,829 | $306,400 | $143,200 | $163,200 |
| 2017 | $4,626 | $283,100 | $119,900 | $163,200 |
| 2016 | $4,575 | $283,100 | $119,900 | $163,200 |
| 2015 | $4,436 | $273,000 | $119,900 | $153,100 |
| 2014 | $4,338 | $273,000 | $119,900 | $153,100 |
Source: Public Records
Map
Nearby Homes
Your Personal Tour Guide
Ask me questions while you tour the home.